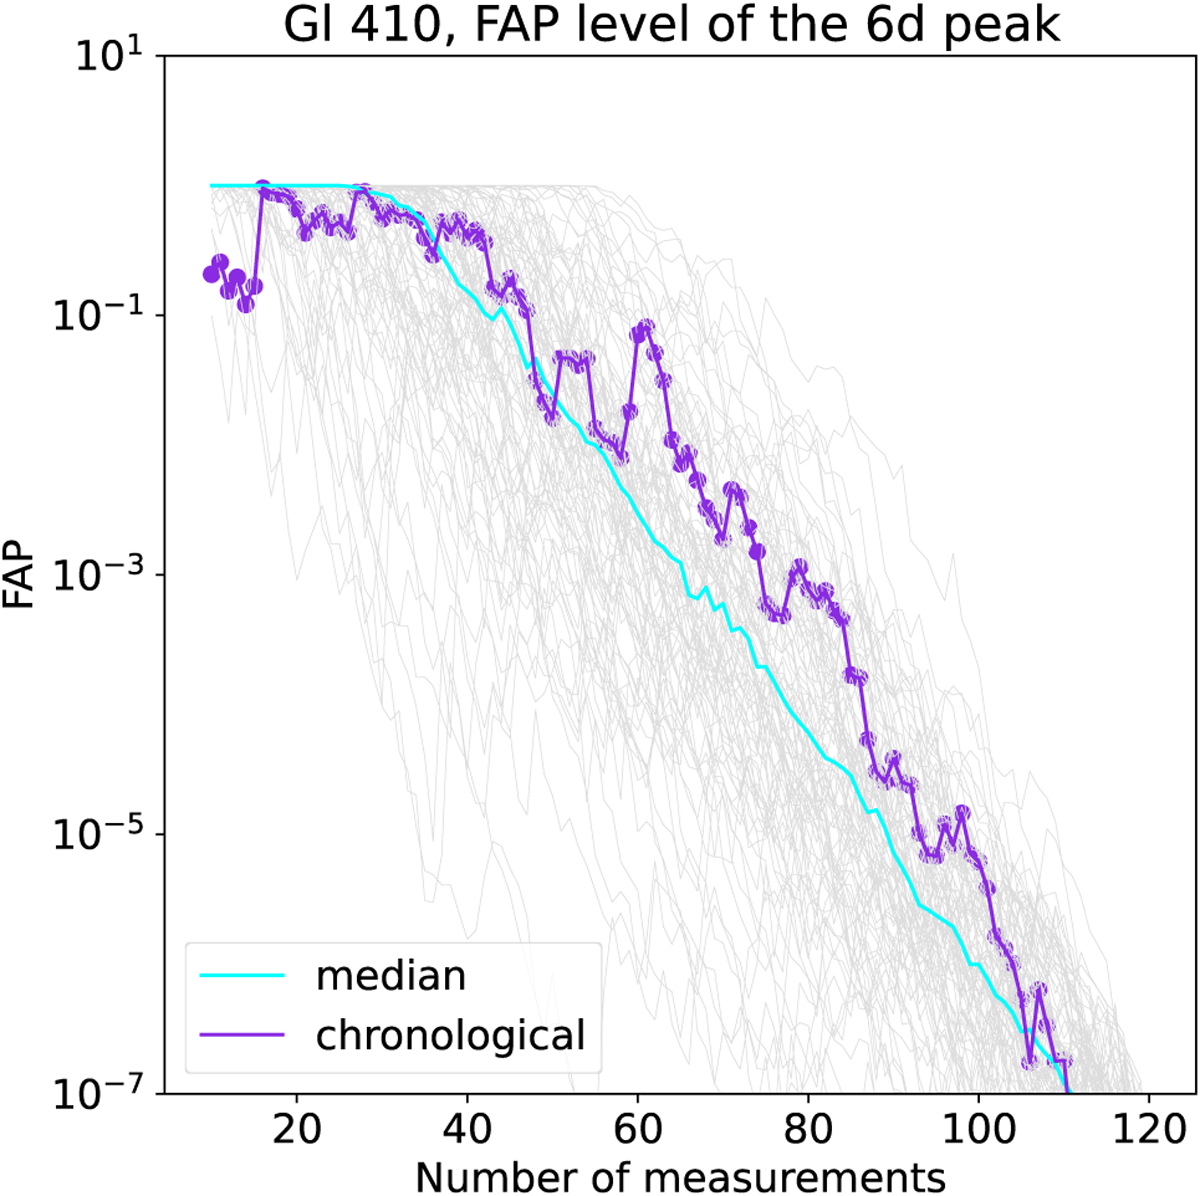
Fig. 4
Download original image
Test on the change of the FAP level of the peak on the peri-odogram at 6 days as a function of the number of visits for 100 randomly selected time series. The FAP level of the Ρ = 6 days peak decreases as a function of the number of measurements, as expected for a planetary origin of the signal. The random time series were sampled from the |Vtot| > 10 km s–1 RV time series. The FAP level in this test was calculated using the analytical approximation implemented in pyAstronomy (Czesla et al. 2019).
Current usage metrics show cumulative count of Article Views (full-text article views including HTML views, PDF and ePub downloads, according to the available data) and Abstracts Views on Vision4Press platform.
Data correspond to usage on the plateform after 2015. The current usage metrics is available 48-96 hours after online publication and is updated daily on week days.
Initial download of the metrics may take a while.