Open Access
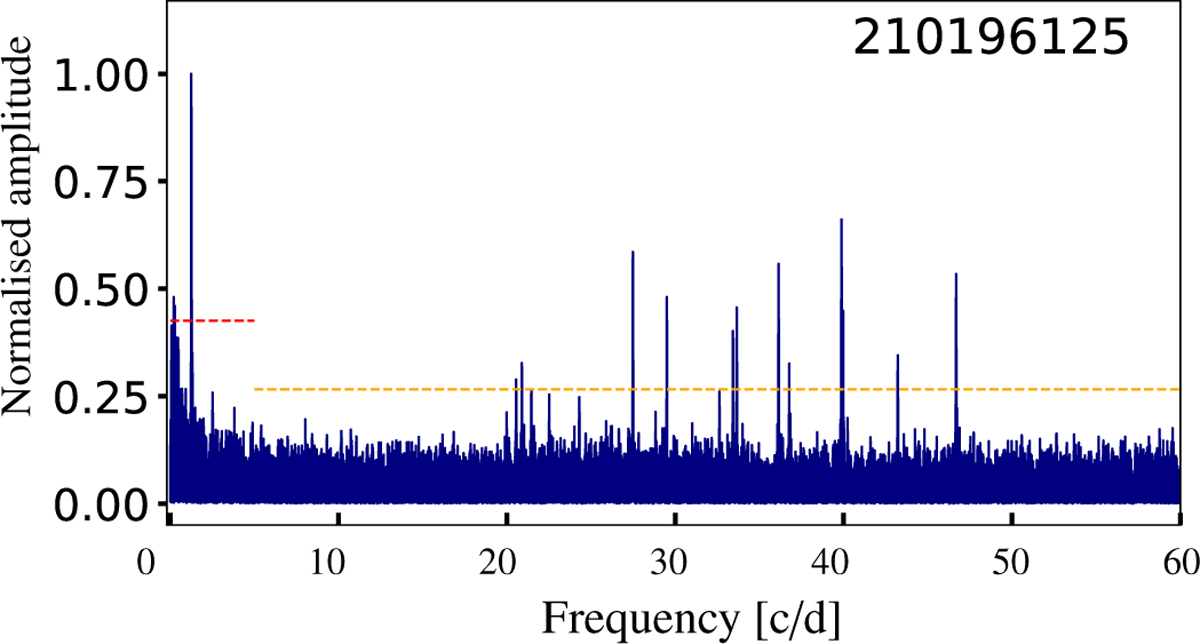
Fig. B.1
Download original image
Normalised periodogram calculated for the sdO star TIC 210196125, displayed over the frequency range 1−60 d−1. Horizontal dashed lines indicate detection thresholds for the low (red) and high (orange) frequency ranges. The pulsation modes visible in the plot originate from a neighbouring δ Scuti star.
Current usage metrics show cumulative count of Article Views (full-text article views including HTML views, PDF and ePub downloads, according to the available data) and Abstracts Views on Vision4Press platform.
Data correspond to usage on the plateform after 2015. The current usage metrics is available 48-96 hours after online publication and is updated daily on week days.
Initial download of the metrics may take a while.