Fig. 2
Download original image
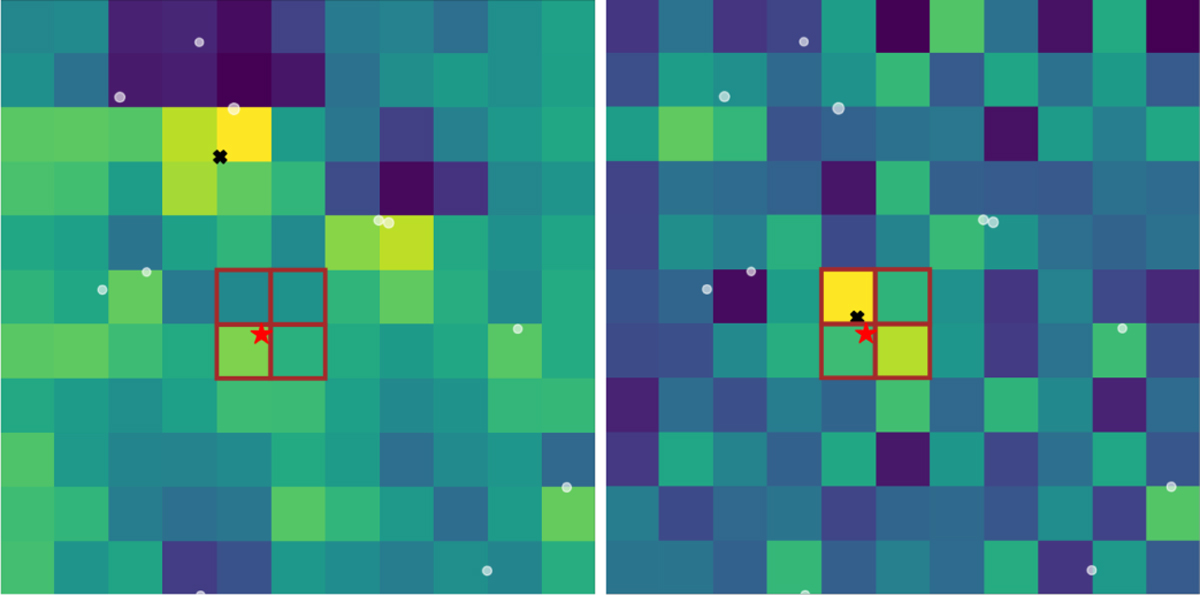
Example heat maps for TIC 33770579 created using TESS-Localize for low-frequency signals (left) and high-frequency signals (right). The target is marked with a red star, and the signal source is indicated with a black cross. The TESS aperture is outlined with red borders around the pixels. The positions of other stars within the frames are marked with white circles.
Current usage metrics show cumulative count of Article Views (full-text article views including HTML views, PDF and ePub downloads, according to the available data) and Abstracts Views on Vision4Press platform.
Data correspond to usage on the plateform after 2015. The current usage metrics is available 48-96 hours after online publication and is updated daily on week days.
Initial download of the metrics may take a while.