Fig. 5
Download original image
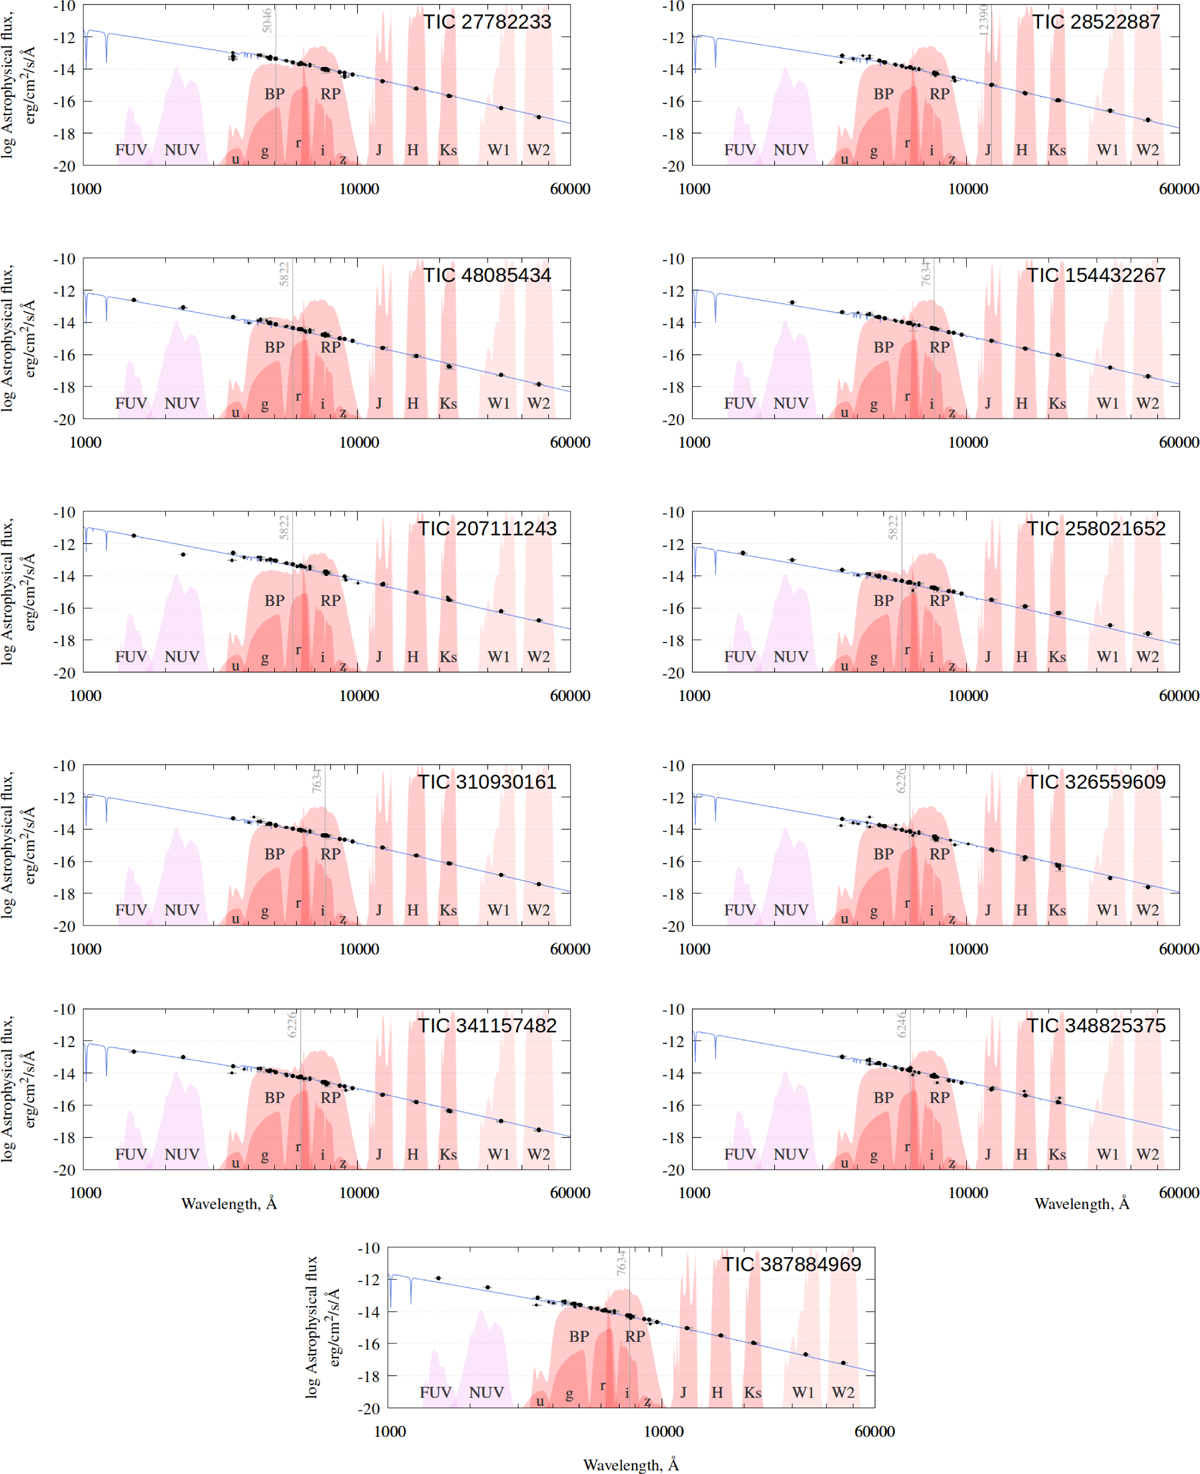
SED plots for 11 stars (Tables 1 and 2) whose spectral data were collected in this work. The blue curves represent the model fits to the spectra, while the SED points are marked with black circles. The filter transmissions of the photometric systems are shown as pink to reddish shaded regions in the background. The photometric system bands are labelled (from left to right in each SED plot) as FUV and NUV for GALEX; u, g, r, i, and z for SDSS; BP and RP for Gaia; J, H, and Ks for 2MASS; and W1 and W2 for WISE. The vertical grey lines mark the wavelengths where the model was normalised to the photometric measurements.
Current usage metrics show cumulative count of Article Views (full-text article views including HTML views, PDF and ePub downloads, according to the available data) and Abstracts Views on Vision4Press platform.
Data correspond to usage on the plateform after 2015. The current usage metrics is available 48-96 hours after online publication and is updated daily on week days.
Initial download of the metrics may take a while.