Open Access
Fig. 7
Download original image
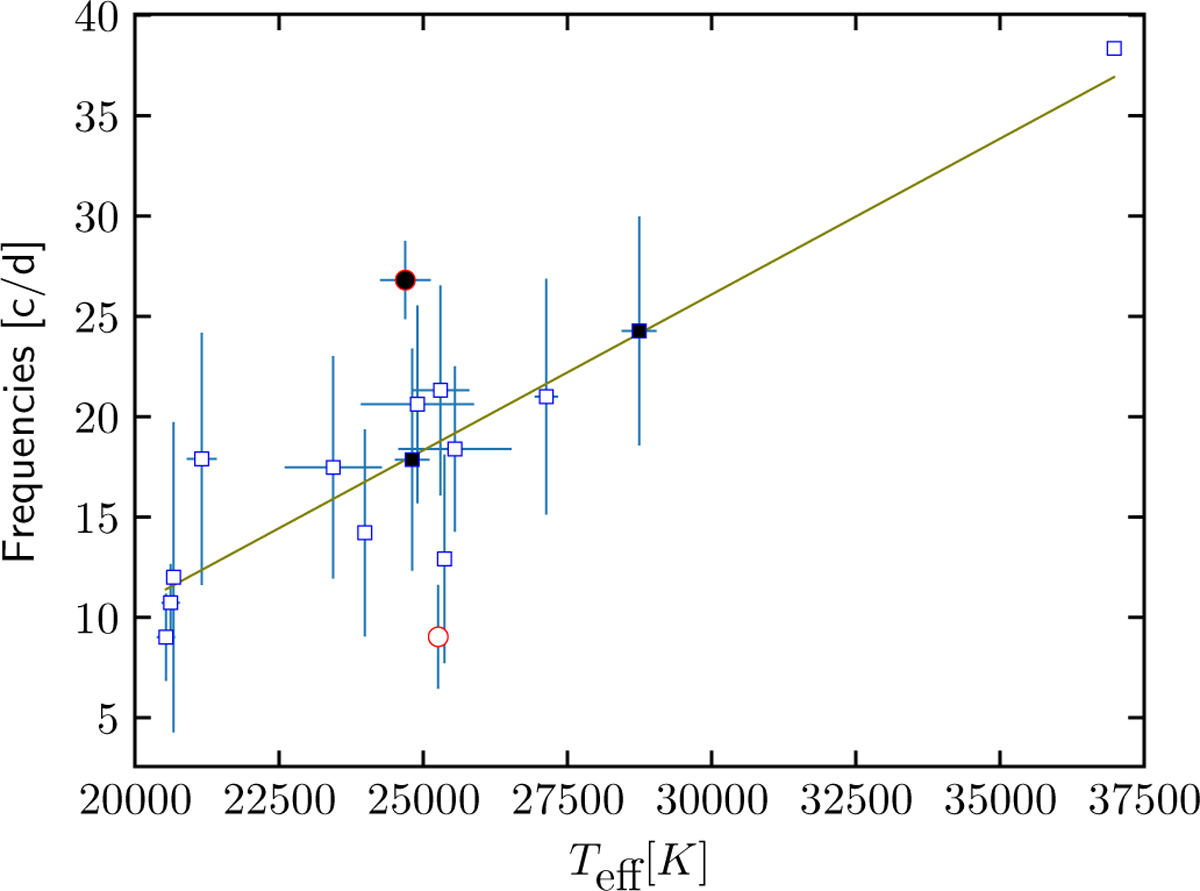
Frequency vs Teff for the 16 sdBV identified as g-mode pulsators in this study for which Teff is known. Pulsating sdBs identified based on frequency peaks exceeding the 4 S/N detection threshold are shown as solid symbols. The circles represent two outliers, and the line is the least-squares fit to all points.
Current usage metrics show cumulative count of Article Views (full-text article views including HTML views, PDF and ePub downloads, according to the available data) and Abstracts Views on Vision4Press platform.
Data correspond to usage on the plateform after 2015. The current usage metrics is available 48-96 hours after online publication and is updated daily on week days.
Initial download of the metrics may take a while.