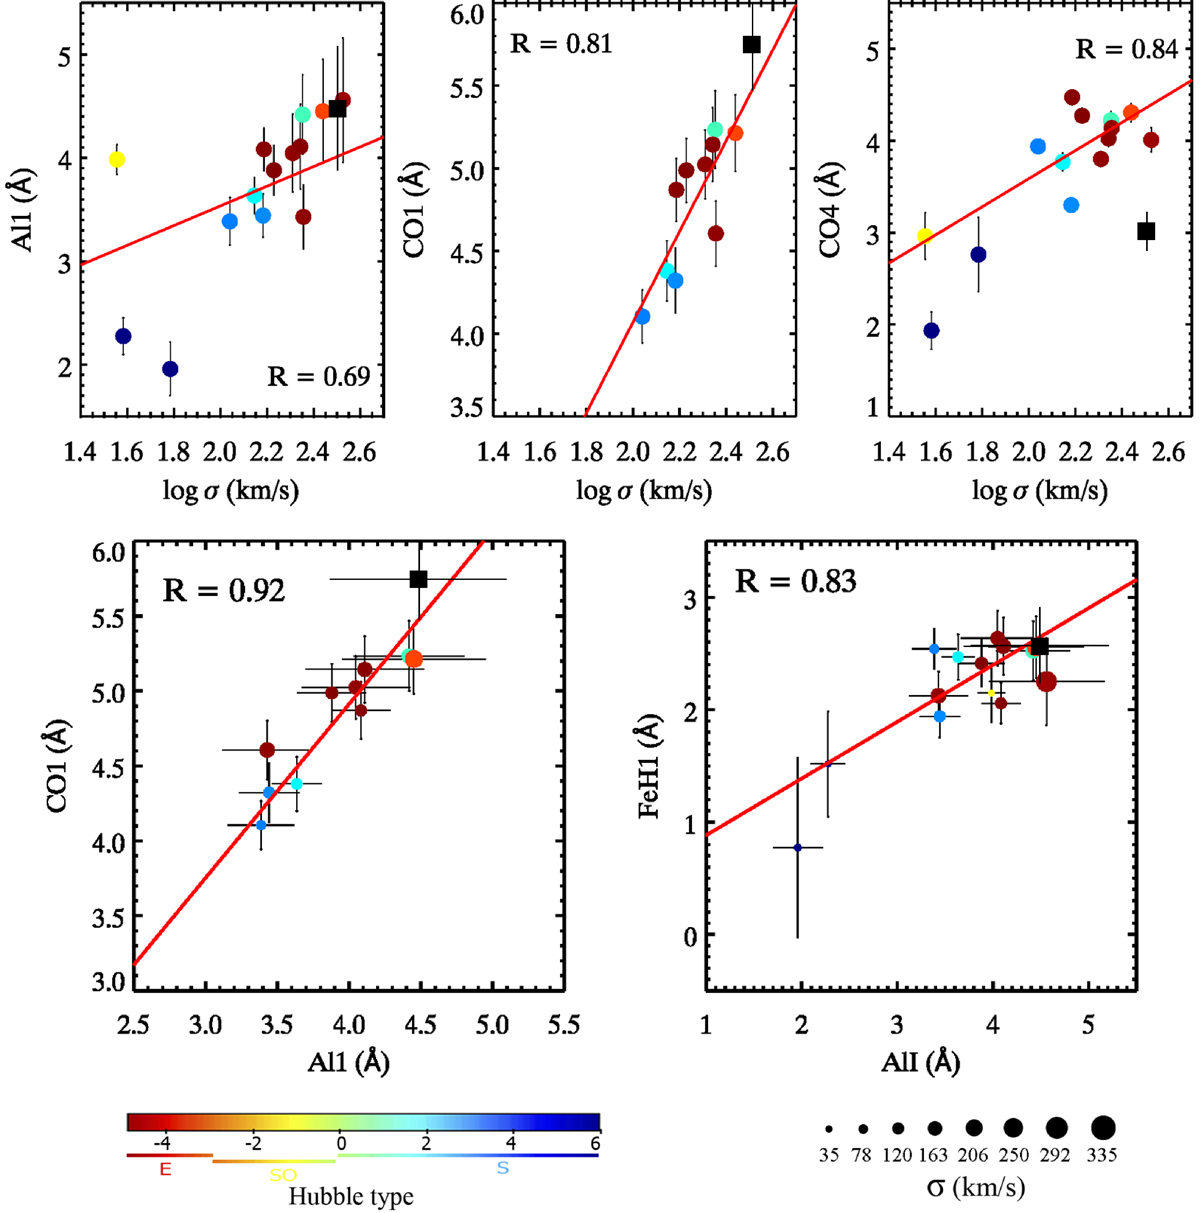
Fig. 3.
Download original image
Correlations between NIR indices and velocity dispersion (upper panel), and between the indices (lower panel), as presented in Figs. 2 and 3 of Gasparri et al. (2021). Red lines represent the best-fitting linear relations derived by the authors, along with the corresponding Pearson correlation coefficients. Sample galaxies are colour-coded by morphological type and in the index-index plots, the symbol sizes are proportional to their central velocity dispersion. The values for IC 4296 are superimposed as a black square.
Current usage metrics show cumulative count of Article Views (full-text article views including HTML views, PDF and ePub downloads, according to the available data) and Abstracts Views on Vision4Press platform.
Data correspond to usage on the plateform after 2015. The current usage metrics is available 48-96 hours after online publication and is updated daily on week days.
Initial download of the metrics may take a while.