| Issue |
A&A
Volume 700, August 2025
|
|
|---|---|---|
| Article Number | A270 | |
| Number of page(s) | 11 | |
| Section | Extragalactic astronomy | |
| DOI | https://doi.org/10.1051/0004-6361/202452644 | |
| Published online | 25 August 2025 | |
Spatially resolved near-infrared spectroscopic indices for the massive elliptical galaxy IC 4296
1
Instituto de Astronomía y Ciencias Planetarias, Universidad de Atacama, Copayapu 485, Copiapó, Chile
2
Departamento de Astronomía, Universidad de La Serena, Av. Raúl Bitrán, 1305 La Serena, Chile
3
European Southern Observatory, Karl-Schwarzschild-Strasse 2, D-85748 Garching bei München, Germany
4
European Southern Observatory, Avenida Alonso de Córdova 3107, Vitacura, Santiago, Chile
5
Dipartimento di Fisica e Astronomia “G. Galilei”, Università di Padova, vicolo dell’Osservatorio 3, I-35122 Padova, Italy
6
INAF-Osservatorio Astronomico di Padova, vicolo dell’Osservatorio 5, I-35122 Padova, Italy
7
Jeremiah Horrocks Institute, University of Central Lancashire, Preston PR1 2HE, UK
8
GEPI, Observatoire de Paris, PSL Research University, CNRS, Université Paris Diderot, Sorbonne Paris Cité, 61 Avenue de l’Observatoire, F-75014 Paris, France
9
Instituto de Astrofísica de Canarias, Calle Vía Láctea s/n, E-38200 La Laguna, Spain
10
Departamento de Astrofísica, Universidad de La Laguna, Calle Astrofísico Francisco Sánchez, E-38205 La Laguna, Spain
11
Millennium Institute of Astrophysics, Nuncio Monsenor Sotero Sanz 100, Of. 104, Providencia, Santiago, Chile
⋆ Corresponding author: This email address is being protected from spambots. You need JavaScript enabled to view it.
Received:
17
October
2024
Accepted:
5
July
2025
Abstract
Context. In the near-infrared (NIR) region, a large number of absorption features may be used to constrain the properties of unresolved stellar populations of galaxies.
Aims. We present the results of a pilot project assessing the feasibility of measuring the distribution and radial trends of NIR line-strength indices on spatially resolved spectra. We used the ESO/KMOS multi-object spectrograph to observe the massive, nearby elliptical galaxy IC 4296.
Methods. We analysed the distribution of the NIR line-strength indices that are most sensitive to the age and metallicity of the galaxy stellar populations both on 2D maps and on stacked spectra of five radial bins. This allowed us to build the radial profiles of the line-strength indices out to 0.80 Re and compare them to those measured in the optical range.
Results. For the particular case of IC 4296, we find that the metal indices have negative radial trends. The results are in agreement with literature radial profiles obtained from the analysis of the optical Lick/IDS indices and favour in situ galaxy formation over multiple merging events.
Conclusions. The obtained results demonstrate the usefulness of the NIR wavelength domain to unveil the processes of galaxy formation and evolution.
Key words: galaxies: evolution / galaxies: formation / galaxies: fundamental parameters / galaxies: star formation / galaxies: stellar content
© The Authors 2025
 Open Access article, published by EDP Sciences, under the terms of the Creative Commons Attribution License (https://creativecommons.org/licenses/by/4.0), which permits unrestricted use, distribution, and reproduction in any medium, provided the original work is properly cited.
This article is published in open access under the Subscribe to Open model. This email address is being protected from spambots. You need JavaScript enabled to view it. to support open access publication.
1. Introduction
Galaxies are dynamical systems containing a mix of stars, gas, and dust, which is the result of a complex formation history and evolution process. The vast majority of external galaxies are unresolved. Their integrated spectra contain sufficient information to recover the kinematic and chemical properties that can be used to study the structure, dynamics, and stellar populations.
The massive early-type galaxies are thought to be assembled through two main processes: a dissipative collapse that generates strong metallicity gradients (Pipino et al. 2010) or merging (Cole et al. 2000; Maiolino & Mannucci 2019) after which the stellar population gradients should be very weak or even absent. A combination of both these processes is also possible (e.g. Naab et al. 2009; Oser et al. 2010) with an early collapse of gas forming the bulk of the stellar component, followed by minor and major mergers with other galaxies. In this case, the gradients of the stellar population properties could be strong or weak depending on the amount of accreted mass in the subsequent merging events. Therefore, an invaluable piece of information to understand the processes of formation and evolution of galaxies is imprinted in the spatial distribution of their stellar populations.
The presence of radial variations in the strengths of the absorption lines of galaxy spectra and, hence, in the stellar properties, was probed since the 1970s (e.g. Welch & Forrester 1972). In the last couple of decades, major observational efforts have been carried out to investigate the gradients of the stellar populations in a large number of bulges (e.g. Jablonka et al. 2007; Morelli et al. 2008, 2012; González Delgado et al. 2014; Seidel et al. 2015; Wilkinson et al. 2015) to be compared with those of elliptical galaxies (e.g. Sánchez-Blázquez et al. 2006; Annibali et al. 2007; Kuntschner et al. 2010; McDermid et al. 2015; Corsini et al. 2018) and galaxy discs (Sánchez-Blázquez et al. 2014; Morelli et al. 2015).
For many years the long-slit spectroscopy sampled the kinematics and stellar populations only along the radial extension of galaxies (e.g. Morelli et al. 2016) and today the 2D spectroscopy maps these properties all over the galaxies. For this reason, integral field spectroscopy (IFS) and multi-object spectroscopy (MOS) studies in the optical range have been performed with increasing samples of galaxies (Sarzi et al. 2006; Sánchez et al. 2012; Fogarty et al. 2015; Konstantopoulos et al. 2015; Bundy et al. 2015; Sarzi et al. 2018). IFS is now considered essential as it is giving an unprecedented view of the kinematic, chemical, and dynamical properties of galaxies (e.g. Cuomo et al. 2022, 2024; Coccato et al. 2024).
The traditional optical range is not the only useful window for studying the stellar population properties of galaxies. The main reason to look at different wavelengths is that different generations of stars dominate the different spectral ranges. During the very early stages of star formation (T ∼ 106 yr), massive stars are responsible for strong UV emission. In subsequent phases (T ∼ 107 yr to a few gigayears), the infrared (IR) and near-infrared (NIR) emission increases due to the growing contribution from red supergiant (RGB) and asymptotic giant branch (AGB) stars. In these wavelength ranges, the integrated spectra of galaxies show significant evolution up to ∼13 Gyr, in contrast to the optical range, which remains nearly unchanged between 4 and 13 Gyr (Bruzual & Charlot 2003). Maraston (2005) showed that, in the K band, RGB and AGB stars account for 60–80% of the total luminosity. Kotilainen et al. (2012) asserted that in the K band, the contribution from stars outside the RGB-AGB phases is negligible for all galaxies, regardless of their Hubble type. Another reason to turn to the NIR is its lower sensitivity to dust extinction compared to the optical range. This characteristic allows us to study the stellar population properties even in heavily dust-obscured galaxies or in globular clusters embedded within galactic bulges (Stephens & Frogel 2004).
Early studies of the most prominent NIR spectral absorption features date back to the 1970s, focussing on the strong CO absorption band at ∼2.3 μm in the central regions of massive early-type galaxies (Frogel et al. 1975). These studies explored the relationship between NIR features and the overall metallicity content of galaxies and globular clusters (Aaronson et al. 1978) and asserted their potential to trace giant star contributions in integrated spectra (e.g. Rieke et al. 1980).
The technological advancement of NIR spectrographs has enabled a more detailed exploration of the potential of this spectral window to constrain the properties of stellar populations in the central regions of galaxies (Cenarro et al. 2001, 2003; Silva et al. 2008; Mármol-Queraltó et al. 2009; Cesetti et al. 2013; Baldwin et al. 2018; Riffel et al. 2019), leading to the definition of new age and metallicity indicators (Riffel et al. 2019; Gasparri et al. 2021, 2024), with accuracies comparable to those achieved in the optical range, and based on a novel NIR line-strength system (Cesetti et al. 2013; Morelli et al. 2020; Eftekhari et al. 2021).
The multiplexing capabilities of the K-band Multi-Object Spectrograph (KMOS; Sharples et al. 2013) enable for spatially resolved spectroscopy across galaxies and have greatly improved our ability to investigate stellar population properties in the NIR. Spatially resolved studies of NIR line-strength indices in galaxies, however, remain limited. La Barbera et al. (2019, 2024) focussed on absorption features initial mass function (IMF) that are sensitive in the K atmospheric window using long-slit spectroscopy. Alton et al. (2017, 2018) used KMOS to investigate the gradients of IMF-sensitive features in the K band, finding no significant radial gradients in their sample galaxies. Finally, a more comprehensive multi-wavelength stellar population analysis of the central regions of an early-type galaxy was conducted by Dahmer-Hahn et al. (2019), comparing the NIR data with optical observations and state-of-the-art models.
In this work, we exploited the multiplexing capabilities of KMOS by deriving 2D maps of Mg, Al, Fe, Na, Ca, Si, CO, and H spectral features in the H and K atmospheric windows (1.5 < λ < 2.3 μm), along with their radial profiles out to 0.8 Re, for the massive elliptical galaxy IC 4296, which has been extensively studied in the optical range. For this pilot project, we collected approximately 2.5 hours of observations in the H and K atmospheric windows, sampling 21 distinct regions out to 0.8 Re, with the aim of placing additional constraints on the formation and evolution of this galaxy. The primary objective of this work is to assess the feasibility of using the strongest NIR line-strength indices as tracers of a galaxy’s evolutionary history, in a manner analogous to what is routinely performed in the optical.
This paper is structured as follows. In Section 2 we present the data. In Section 3 we describe the data reduction process. In Section 4 we report the measurements of nine line-strength indices as defined by Cesetti et al. (2013) and Morelli et al. (2020), six in the H atmospheric window and three in the K atmospheric window, including the prominent Na and CO band-heads. The results are discussed in Section 5. Finally, our conclusions are summarised in Section 6.
2. IC 4296 and spectroscopic observations
The target of this pilot project is the massive early-type galaxy IC 4296 (MV = −23.3 according to the NED database1). Located in the Southern constellation of Centaurus, it is a bright object with H = 7.776 mag and K = 7.502 mag. It extends over approximately 2 arcmin on the sky (Skrutskie et al. 2006), making it an ideal candidate for spatially resolved observations with KMOS within a limited observing time.
IC 4296 is the brightest member of the 18-galaxy assembly known as the Nearby Optical Galaxy Group 722, which is part of the galaxy cluster A3565 (Giuricin et al. 2000). Morphologically, it is classified as a pure elliptical galaxy (Younis et al. 1985), with an effective radius Re = 57 arcsec (Burstein et al. 1987), a surface brightness distribution that is well described by a Sérsic profile. There is no evidence for an embedded exponential disc component that would be indicative of ongoing or recent star formation (Donzelli et al. 2011).
Its IR colours are consistent with those of a passively evolving, gas-poor system. In particular, the lack of excess emission in the mid-infrared (MIR) suggests the absence of warm dust typically associated with star-forming regions, supporting the classification of IC 4296 as a ‘red and dead’ galaxy (Temi et al. 2009). This makes it an excellent laboratory for isolating and studying the effects of long-term stellar population evolution, without any contamination from recent star formation episodes.
IC 4296 has been the subject of extensive studies, which provide a solid reference for comparative investigations in the NIR regime. It has a flat velocity dispersion profile with σ ∼ 300 km s−1(Efstathiou et al. 1980; Franx et al. 1989) and it is considered to be a fast rotator, with a counter-rotating inner core (|R|< 5 arcsec) and a flat rotational velocity profile (Franx et al. 1989; Saglia et al. 1993; Rubino et al. 2021). It is a strong radio source with a complex morphology due to the central active galactic nucleus activity (Condon et al. 2021, and references therein).
Optical line-strength index radial profiles and gradients were measured by Efstathiou et al. (1980), Saglia et al. (1993), and Rampazzo et al. (2005). All these studies found negative Mg2 and Fe gradients and slightly positive Hβ gradients out to 1 Re. They concluded that IC 4296 is dominated by an old population, with no on-going star formation, which was assembled in the early stages of the Universe with a main formation process consistent with an in situ assembly. Its relatively low redshift (z ∼ 0.012) ensures high spatial resolution in physical units, which is essential for probing gradients out to large fractions of the effective radius.
Observations of IC 4296 were performed with the KMOS instrument with the HK grating that simultaneously covers both H and K atmospheric windows (1.5 ≤ λ ≤ 2.3 μm, P.I. L. Morelli, Programme ID: 099.B-0575(A)). KMOS has 24 configurable fs (IFUs) that sample an area of 2.8 × 2.8 arcsec2. The observation strategy was performed as follows: one IFU was superimposed to the centre of the galaxy. Twenty of them were arranged to uniformly map regions out to 0.8 Re, following the nearly circular isophotes of IC 4296 (Fig. 1). Two IFUs were targeting an external region (∼8 Re from the centre) to sample the sky. One IFU was not active. The exposure time was 428 s × 4 (DIT × NDIT) for five exposures (NINT), where DIT is the detector integration time, NDIT is the number of DIT exposures averaged out within the same frame, and NINT is the number of frames. The mean airmass of the observations was 1.3 and the average seeing was FWHM = 1.5 arcsec. The total observation time dedicated to this project was ∼2.5 hours which proved to be enough to build maps out to ∼0.5 Re with a S/N ≳10 for the strongest NIR line-strength indices in the H and K atmospheric windows. Considering the surface-brightness radial profile of IC 4296 (Younis et al. 1985), this threshold corresponds to a surface brightness of ∼21 mag arcsec−2 in the J band and ∼22.5 mag arcsec−2 in the R band.
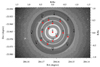 |
Fig. 1. V-band isophotal contours of IC 4296 with distribution and ID number of the KMOS IFUs. Red squares are the inner IFUs with S/N > 10 per pixel used to measure the EW of the strongest line-strength indices. Black points are the outer IFUs with lower S/N. The shaded annuli are the radial bins considered to average the IFUs and construct the radial gradients of the line-strength indices. Image courtesy of the Carnegie-Irvine Galaxy Survey (CGS, Ho et al. 2011). |
3. Data reduction and line-strength index measurements
We reduced the data within the ESOREFLEX environment (Freudling et al. 2013) using the KMOS pipeline and with the Molecfit recipe (Smette et al. 2015) to correct the telluric absorption. The output of the ESOREFLEX process are 2D spectra of the 23 active IFUs for any exposure. We extracted 1D spectra for each IFU targeting the galaxy by summing the signal from the 14 × 14 pixel area, then we co-added the 1D spectra of each exposure. The final 21 1D spectra of the galaxy were cleaned of cosmic rays and residual sky with a 3σ rejection algorithm. The spectral resolving power is R ∼ 1800, and the wavelength sampling is Δλ = 4.6 Å pix−1.
The mean S/N per pixel of the bins is strongly dependent on the galactocentric distance. The central IFU has the highest S/N (∼150 per pixel in the H band), whereas the most distant ones have typically S/N ≲ 5 per pixel, which is too low to perform any reliable measure. Therefore, we considered only the 13 IFUs with a mean S/N > 10 per pixel in the H atmospheric window. In Fig. 1, we show the distribution of the IFUs. The red dots mark IFUs with S/N > 10.
We measured the line-of-sight velocity and velocity dispersion of the stellar component using a modified version of the penalized pixel fitting algorithm (pPXF; Cappellari & Emsellem 2004; Cappellari 2023). The mean velocity dispersion results to be σ = 316 ± 76 km s−1. This value is in excellent agreement with the literature data (Efstathiou et al. 1980; Saglia et al. 1993).
In the observed spectral range, there are 21 line-strength indices among those defined by Cesetti et al. (2013) and Morelli et al. (2020), and tested in the central regions of galaxies by Gasparri et al. (2021, 2024). We selected the twelve strongest metallicity indices and the hydrogen Br10 index. The definitions of the measured indices are reported in Table 1. As done in Gasparri et al. (2021), we measured the equivalent width (EW) of the line-strength indices using a dedicated Python routine after de-redshifting the spectra.
NIR line-strength indices measured in this work.
Morelli et al. (2020) showed that at low signal-to-noise ratios (S/N ∼ 10 per pixel), the EWs of some NIR indices may suffer from non-stochastic effects, introducing a systematic bias towards lower values. This issue could significantly affect our measurements, particularly the derivation of reliable radial profiles. To quantify this effect, we performed a set of dedicated simulations. We selected the central spectrum of IC 4296 and we fitted it using pPXF, adopting the E-MILES BASTI simple stellar population models (Vazdekis et al. 2016) with a Kroupa IMF. From the best-fitting model, we generated 1000 mock spectra by adding Poissonian noise across a range of S/N values, from 100 down to 5 per pixel. For each S/N level, we measured the EWs of our NIR indices across all realisations. In Fig. 2, we plot both the individual and mean values as a function of S/N.
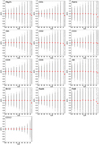 |
Fig. 2. Relative variation of the EW of the 13 NIR indices measured in this paper as a function of the S/N for 1000 simulated spectra for each S/N value. Black points represent the single EW for each simulated spectrum. Red points represent the mean values. |
The results highlight a systematic decrease in the mean EW at low S/N levels. At S/N = 5 per pixel, deviations up to 30% are observed for several indices. In particular, FeH1, CO2, and Al1 show declining trends already from S/N = 20 per pixel, though the variation remains within 5%. Mg2h and FeB display fluctuations within ±5% starting from S/N = 30 and 60 per pixel, respectively. Notably, Nadk and CO12 exhibit robust behaviour, with systematic deviations below 2.5%, even at the lowest S/N values. Based on these results, we conservatively adopted a threshold of S/N ≥ 20 per pixel in the pseudo-continuum regions to consider our EW measurements as reliable for the subsequent analysis.
Finally, the raw EWs measured to the spectral bins of IC 4296 within the given S/N constraints, are corrected to the common zero velocity dispersion frame by applying the velocity dispersion correction coefficients of Gasparri et al. (2021). We added the uncertainties in the coefficients in quadrature to the errors in the EW estimated via Monte Carlo simulations.
4. Results
As a first sanity check, we compared the EW of the central IFU of IC 4296 with literature data. The line-strength indices in the K atmospheric window were measured by Cesetti et al. (2009). The EWs of our Nadk index and those of the corresponding NaI index by Cesetti et al. (2009) are in excellent agreement within the uncertainties.
To further test the values of the indices measured for IC 4296, we compared them with the measurements obtained by Gasparri et al. (2021) for a sample of galaxies with a morphological type ranging from ellipticals to spirals. In Fig. 3, we reproduce the distribution of the central values of the indices measured by Gasparri et al. (2021) and we overplot for comparison the position of line-strength indices measured in the central IFU of IC4296 (black square symbol). The upper panel of Fig. 3 shows the index–σ correlations for the Al1, CO1, and CO4 indices, the linear fits, and the Pearson correlation coefficients as given by Gasparri et al. (2021). The different number of galaxies in the different plots depends on the S/N constraints set by the authors in the original paper. IC 4296 lies in the locus of massive galaxies and its position is consistent with the correlations obtained by the authors in the Al1-σ and CO1-σ planes (red line). Only in the CO4-σ plane, IC 4296 is significantly lower than expected. After a careful inspection of the spectrum of the central bin of IC 4296, we can confirm this is not due to low S/N or contamination.
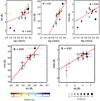 |
Fig. 3. Correlations between NIR indices and velocity dispersion (upper panel), and between the indices (lower panel), as presented in Figs. 2 and 3 of Gasparri et al. (2021). Red lines represent the best-fitting linear relations derived by the authors, along with the corresponding Pearson correlation coefficients. Sample galaxies are colour-coded by morphological type and in the index-index plots, the symbol sizes are proportional to their central velocity dispersion. The values for IC 4296 are superimposed as a black square. |
The lower panels of Fig. 3 present relations between Al1–CO1 and Al1–FeH1, where the symbol sizes scale with galaxy velocity dispersion. IC 4296 lies in the locus of most massive galaxies and its position is consistent with the correlations obtained by Gasparri et al. (2021) in the Al1–CO1 and Al1–FeH1 plane (red line). These comparisons support the reliability of NIR line-strength indices measured for IC 4296 and confirm their consistency with previously published results for similar galaxies.
The spatial distribution of the line-strength indices Mg2h, FeH1, Sih, CO, Al1, and Br10 in the H atmospheric window and Nadk, FeB, and CO12 in the K atmospheric window are shown in Fig. 4 and their values are tabulated in Table 2. The CO index is the sum of the CO1, CO2, CO3, CO4, and CO5 band-head indices spanning the 1.56 < λ < 1.66 μm range. Their EWs are reported in Table A.1. To homogeneously compare the plots, we normalise the EW of each index to its central value, which is marked in green. Bluish hues indicate a fractional decrease relative to the central value, whereas reddish hues indicate a fractional increase. Black dots indicate no data due to low S/N, as measured in the index pseudo-continuum bands.
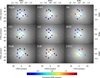 |
Fig. 4. Maps of nine NIR line-strength indices measured within the 13 internal IFUs with S/N > 10 per pixel. EWs are normalised to their central values. Relative variation of ±90% are shown. Black squares indicate no data due to low S/N in the index pseudo-continuum bands. |
KMOS IFU properties and NIR line-strength measurements.
The distribution of the EWs indicate that the values of several line-strength indices are larger in the centre than in the outer parts of IC 4296. The most notable exception is the FeB index, for which the outer regions (> 15 arcsec) display larger EW values than the central IFU. This could be due to the combination of low S/N of the pseudo-continuum bands of the FeB index with the weak intensity of the absorption line.
The advantage of this method with respect to map the stellar population properties along the major axis of the galaxy is that, in addition to their radial gradients, we can also highlight local variations. A deeper insight of Fig. 4 reveals that the distribution of the EWs of the CO, Al1, and FeH1 indices is similar to each other. They have larger EWs (green and light blue squares) for the IFUs roughly positioned along the equatorial plane of the sky (δ Dec ∼ 0 arcsec, −40 < δ RA < 30 arcsec). This could indicate local variation in the stellar population properties.
To derive the radial profile of the EW measurements, we stacked together the spectra of the IFUs contained in four concentric annuli with a mean radius of 0.23, 0.40, 0.58, and 0.82 Re, respectively and amplitude 0.1 Re. This process increases the mean S/N of the spectra to S/N ∼ 40 per pixel for the H atmospheric window and S/N ∼ 20 per pixel for the K atmospheric window.
In Fig. 5, the 1D spectra obtained for each radial bin and the central IFU are shown along with the indication of the galactocentric distance. For each binned spectrum, we measured the EW of the line-strength indices as described in Section 3 and their values are tabulated in Table 3. The EW of the single CO indices in the H band used to build the composite CO index are reported in Table A.2. The radial trend of the values of the line-strength indices measured for all the radial bins are shown in Fig. 6 and Fig. 7, together with the linear regression through all the data points considering the uncertainties.
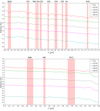 |
Fig. 5. Smoothed spectra for the five radial bins used to analyse the variations of the NIR line-strength indices. The central bands of the measured indices are reported as red shaded areas, as defined in Cesetti et al. (2013) and Morelli et al. (2020). |
EWs in Å of the four radial bins and the central IFU.
The Sih, CO, Al1, and Nadk indices show robust negative gradients along the galaxy radius, being the CO index the steepest. These results are consistent with the literature (Saglia et al. 1993; Rampazzo et al. 2005) that targeted the optical Mg2 index. There is more uncertainty with respect to the cases of Mg2h, FeH1, and CO12, where the negative trend is largely driven from the outermost or innermost data points. The strong CO12 band-head in the K atmospheric window has a nearly constant or slightly increasing trend for all the radial bins, except for the most external one. This behaviour is different from the composite CO index in the H atmospheric window.
The only hydrogen line-strength index measured, which can trace the age of the stellar populations, the Br10 index, is nearly constant with the radial distance. This is consistent with the results of Rampazzo et al. (2005), where a nearly flat radial profile was found for the optical age indicator, Hβ.
The FeB is the only line-strength index with a weak positive or flat (considering the larger error bars of the two external bins) radial trend. This is peculiar in general for an iron-based index and in particular for this galaxy, for which the other NIR iron-based FeH1 index, and the results obtained for metal indices in the optical range, show negative gradients (Saglia et al. 1993; Rampazzo et al. 2005). However, the FeB index is very weak, even for the high S/N spectra of the central bin, and we were not able to draw a strong conclusion.
In Fig. 6, we show that the composite CO index, defined as the sum of five individual CO indices shows the steepest gradient along the radius. However, summing indices in the NIR, where sky contamination is significant, could introduce biases. For this reason, in Fig. 7 we show the radial profiles of the five individual CO indices within the H atmospheric window that have been used to construct the composite CO index shown in Fig. 6. The CO1, CO2, CO3, and CO4 indices exhibit a clear and monotonic decrease with increasing galactocentric distance across all radial bins, supporting a well-defined negative gradient and only the CO2 shows a slightly higher scatter with respect to the others. The CO5 index has the weakest negative trend since it is driven from the high value of the first bin. The results of the individual indices confirm the gradient shown by the composite CO absorption features in IC 4296.
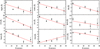 |
Fig. 6. Radial profiles for the four radial bins plus the central value of the nine strongest NIR indices. The red line is the best fit of the data considering the uncertainties. |
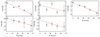 |
Fig. 7. Radial profiles for the five H band CO indices. The red line is the best fit of the data considering the uncertainties. |
5. Discussion
As general results traced by Fig. 4, we found that, with the exception of FeB, all the measured indices in IC 4296 have higher values in the central than in the outer regions, with composite CO showing negative gradient along the radius (Fig. 6). This is also confirmed when the individual CO indices in the H and K atmospheric windows are plotted as function of the galactic radius (Fig. 7). The similar spatial distribution of the metal-sensitive indices CO, Al1, FeH1, and the CO indices (Fig. 4) suggests that they might be targeting common properties of the stellar populations.
The role of the CO features in the NIR is still debated. The CO absorptions in the H and K atmospheric windows are expected to show different behaviours as a function of the stellar population properties (Origlia et al. 1993; Eftekhari et al. 2022a) and few observational studies have been conducted for the H atmospheric window CO features of galaxies (e.g Riffel et al. 2019). A number of authors (e.g. Mobasher & James 1996; Davidge et al. 2008; Mármol-Queraltó et al. 2009) have connected the strong CO absorption band-heads (especially in the K atmospheric windows) with the presence of younger, evolved (AGB and RGB) stars whose light dominates the NIR spectra (Kotilainen et al. 2012). However, the presence of stronger CO line strengths in more massive early-type galaxies (Gasparri et al. 2021; Eftekhari et al. 2022b) have challenged this interpretation. The detected CO absorption in early-type galaxies may be due more to a carbon overabundance than to the presence of a young stellar population (Eftekhari et al. 2022a). Eftekhari et al. (2022b) documented this for NGC 1277, which exhibits strong CO absorption in both H and K bands, despite its well-established old stellar population. These authors concluded that intermediate-age stellar populations in massive early-type galaxies are not the culprit of the strong CO absorptions.
Other authors did not find a direct connection between the metallicity gradients and CO line-strengths (La Barbera et al. 2024) in H and K atmospheric windows. On the other hand, observational studies of the central regions of galaxies, Cesetti et al. (2009), Gasparri et al. (2021) found that the Al1, FeH1, and CO1 indices have strong correlations with the optical Lick Image Dissector Scanner (Lick/IDS) indices used as metallicity indicators (e.g. Fig. 2 of Gasparri et al. 2024).
The results obtained for the elliptical galaxy IC 4296 confirm the presence of this trend between the NIR indices, the Lick/IDS indices and the metallicity. In fact based on the radial analysis of the line-strength indices in the optical range, Saglia et al. (1993) and Rampazzo et al. (2005) found that IC 4296 has a pronounced radial gradient of metallicity. The radial negative gradients we found for the metal indices in the H atmospheric window and the Nadk in the K atmospheric window, confirm this picture and the reliability of the NIR line-strength indices to study the stellar populations.
Current theoretical frameworks consider both in situ dissipative collapse (e.g. Eggen et al. 1962; Sandage 1990; Gilmore & Wyse 1998) and external mechanisms such as merging and accretion events (e.g. Cole et al. 2000) as viable channels for the formation of massive classical spheroids like IC 4296. Among the various stellar population indicators, the metallicity gradient is generally regarded as the most robust tracer for constraining the role of gas dissipation and the impact of merger histories. In the context of dissipative collapse, stars are expected to form throughout the protogalactic cloud and largely retain their original orbital radii, experiencing minimal inward migration. This scenario leads to the development of steep negative radial gradients in metallicity, as both star formation activity and feedback-driven galactic winds act to accentuate any initial spatial variations (e.g. Arimoto & Yoshii 1987; Creasey et al. 2013; Hirschmann et al. 2015). Conversely, hierarchical models offer a more nuanced perspective. Some studies suggest that clustering processes and merging, either gas-rich (wet) or gas-poor (dry), can effectively flatten or erase pre-existing metallicity gradients (e.g. Bekki & Shioya 1999; Di Matteo et al. 2009).
Our finding that IC 4296 exhibits pronounced radial trends of metallicity sensitive indices supports an in situ formation process of the galaxy over multiple merging events (Méndez-Abreu et al. 2012, 2018), at least within the radial distance studied in this work. Merging events seem to be the dominant assembling mechanism in the outskirts of massive early-type galaxies, as pointed out by Oyarzún et al. (2019), Lacerna et al. (2020), Ibarra-Medel et al. (2022). Indeed, the EW maps of the available IFUs at higher spatial resolution reveal that there might be inhomogeneities in the distribution of the stellar populations of the galaxy.
6. Conclusions
In this paper we presented the results of a pilot project to study the stellar populations in the NIR wavelength range for the massive early-type galaxy IC 4296.
We used IFS observations performed with the ESO/KMOS multi object spectrograph in the H and K atmospheric windows (1.5 ≤ λ ≤ 2.3 μm). We measured the strongest NIR indices and build their maps out to ∼0.5 Re for 13 IFUs and radial profiles for five bins out to ∼0.80 Re. We found enhanced central values for several metal indices in agreement with the EWs measured for the central regions of elliptical galaxies, as well as hints for different distribution of the stellar populations. We also found radial profiles of metal and hydrogen indices consistent with literature findings in the optical atmospheric window (e.g. Saglia et al. 1993; Rampazzo et al. 2005).
With this pilot project, we probe the feasibility of using KMOS to derive NIR spatially resolved spectra with the state-of-the-art MOS to gather valuable data within the effective radius of nearby and bright galaxies. Longer exposure times are needed to achieve higher S/N for regions beyond 0.50 Re and/or smaller uncertainties in the inner regions. A ten-hour observation improves the S/N of ∼2 times, which corresponds to an improvement of ∼1.5 mag arcsec−2 in the limiting surface magnitude. This exposure time also allows us to measure the fainter line-strength indices in the H and K atmospheric windows.
An investigation across a wider NIR wavelength range is recommended. Overall, we cannot measure the newly defined age and metallicity NIR indicators of Gasparri et al. (2024) because some of the line-strength indices (e.g. Paβ, Al, and CaT) are outside the observed wavelength range. KMOS has five available gratings, but it cannot provide the required wide wavelength coverage, which should be focussed mainly in the Y, J, and H atmospheric windows.
Considering the increasing availability of multi-object NIR spectrographs, such as EMIR mounted at the GTC telescope (Garzon et al. 2004) and the future HARMONI of the ELT (Thatte et al. 2021), the NIR regime can be considered as a complementary tool to the optical atmospheric window to study the stellar content of local galaxies throughout spatially resolved spectroscopy.
The NASA/IPAC Extragalactic Database (NED) is funded by the National Aeronautics and Space Administration and operated by the California Institute of Technology.
Acknowledgments
We thank the anonymous referee for the constructive and insightful comments that helped improve the quality of this paper. DG acknowledges the support from Comité Mixto ESO-Gobierno de Chile Grant no. ORP060/19. DG and LM acknowledge the support from PROYECTOS FONDO de ASTRONOMIA ANID – ALMA 2021 Code :ASTRO21-0007 VC acknowledges the support provided by ANID through the FONDECYT grants no. 3220206 and 11250723. EMC, EDB, and AP are supported by the Istituto Nazionale di Astrofisica (INAF) grant Progetto di Ricerca di Interesse Nazionale (PRIN) 2022 C53D23000850006 and Padua University grants Dotazione Ordinaria Ricerca (DOR) 2022–2024.
References
- Aaronson, M., Cohen, J. G., Mould, J., & Malkan, M. 1978, ApJ, 223, 824 [Google Scholar]
- Alton, P. D., Smith, R. J., & Lucey, J. R. 2017, MNRAS, 468, 1594 [NASA ADS] [Google Scholar]
- Alton, P. D., Smith, R. J., & Lucey, J. R. 2018, MNRAS, 478, 4464 [CrossRef] [Google Scholar]
- Annibali, F., Bressan, A., Rampazzo, R., Zeilinger, W. W., & Danese, L. 2007, A&A, 463, 455 [NASA ADS] [CrossRef] [EDP Sciences] [Google Scholar]
- Arimoto, N., & Yoshii, Y. 1987, A&A, 173, 23 [NASA ADS] [Google Scholar]
- Baldwin, C., McDermid, R. M., Kuntschner, H., Maraston, C., & Conroy, C. 2018, MNRAS, 473, 4698 [Google Scholar]
- Bekki, K., & Shioya, Y. 1999, ApJ, 513, 108 [NASA ADS] [CrossRef] [Google Scholar]
- Bruzual, G., & Charlot, S. 2003, MNRAS, 344, 1000 [NASA ADS] [CrossRef] [Google Scholar]
- Bundy, K., Bershady, M. A., Law, D. R., et al. 2015, ApJ, 798, 7 [Google Scholar]
- Burstein, D., Davies, R. L., Dressler, A., et al. 1987, ApJS, 64, 601 [Google Scholar]
- Cappellari, M. 2023, MNRAS, 526, 3273 [NASA ADS] [CrossRef] [Google Scholar]
- Cappellari, M., & Emsellem, E. 2004, PASP, 116, 138 [Google Scholar]
- Cenarro, A. J., Cardiel, N., Gorgas, J., et al. 2001, MNRAS, 326, 959 [NASA ADS] [CrossRef] [Google Scholar]
- Cenarro, A. J., Gorgas, J., Vazdekis, A., Cardiel, N., & Peletier, R. F. 2003, MNRAS, 339, L12 [NASA ADS] [CrossRef] [Google Scholar]
- Cesetti, M., Ivanov, V. D., Morelli, L., et al. 2009, A&A, 497, 41 [NASA ADS] [CrossRef] [EDP Sciences] [Google Scholar]
- Cesetti, M., Pizzella, A., Ivanov, V. D., et al. 2013, A&A, 549, A129 [NASA ADS] [CrossRef] [EDP Sciences] [Google Scholar]
- Coccato, L., Morelli, L., Pizzella, A., Corsini, E. M., & Cuomo, V. 2024, A&A, 691, A342 [NASA ADS] [CrossRef] [EDP Sciences] [Google Scholar]
- Cole, S., Lacey, C. G., Baugh, C. M., & Frenk, C. S. 2000, MNRAS, 319, 168 [Google Scholar]
- Condon, J. J., Cotton, W. D., White, S. V., et al. 2021, ApJ, 917, 18 [CrossRef] [Google Scholar]
- Corsini, E. M., Morelli, L., Zarattini, S., et al. 2018, A&A, 618, A172 [NASA ADS] [CrossRef] [EDP Sciences] [Google Scholar]
- Creasey, P., Theuns, T., & Bower, R. G. 2013, MNRAS, 429, 1922 [NASA ADS] [CrossRef] [Google Scholar]
- Cuomo, V., Corsini, E. M., Morelli, L., et al. 2022, MNRAS, 516, L24 [CrossRef] [Google Scholar]
- Cuomo, V., Morelli, L., Aguerri, J. A. L., et al. 2024, MNRAS, 527, 11218 [Google Scholar]
- Dahmer-Hahn, L. G., Riffel, R., Steiner, J. E., et al. 2019, MNRAS, 482, 5211 [NASA ADS] [CrossRef] [Google Scholar]
- Davidge, T. J., Beck, T. L., & McGregor, P. J. 2008, ApJ, 677, 238 [Google Scholar]
- Di Matteo, P., Pipino, A., Lehnert, M. D., Combes, F., & Semelin, B. 2009, A&A, 499, 427 [NASA ADS] [CrossRef] [EDP Sciences] [Google Scholar]
- Donzelli, C. J., Muriel, H., & Madrid, J. P. 2011, ApJS, 195, 15 [Google Scholar]
- Efstathiou, G., Ellis, R. S., & Carter, D. 1980, MNRAS, 193, 931 [Google Scholar]
- Eftekhari, E., Vazdekis, A., & La Barbera, F. 2021, MNRAS, 504, 2190 [CrossRef] [Google Scholar]
- Eftekhari, E., La Barbera, F., Vazdekis, A., Allende Prieto, C., & Knowles, A. T. 2022a, MNRAS, 512, 378 [NASA ADS] [CrossRef] [Google Scholar]
- Eftekhari, E., La Barbera, F., Vazdekis, A., & Beasley, M. 2022b, MNRAS, 515, L56 [CrossRef] [Google Scholar]
- Eggen, O. J., Lynden-Bell, D., & Sandage, A. R. 1962, ApJ, 136, 748 [NASA ADS] [CrossRef] [Google Scholar]
- Fogarty, L. M. R., Scott, N., Owers, M. S., et al. 2015, MNRAS, 454, 2050 [NASA ADS] [CrossRef] [Google Scholar]
- Franx, M., Illingworth, G., & Heckman, T. 1989, ApJ, 344, 613 [Google Scholar]
- Freudling, W., Romaniello, M., Bramich, D. M., et al. 2013, A&A, 559, A96 [NASA ADS] [CrossRef] [EDP Sciences] [Google Scholar]
- Frogel, J. A., Persson, S. E., Aaronson, M., et al. 1975, ApJ, 195, L15 [Google Scholar]
- Garzon, F., Abreu, D., Barrera, S., et al. 2004, in Ground-based Instrumentation for Astronomy, eds. A. F. M. Moorwood, & M. Iye, SPIE Conf. Ser., 5492, 1187 [Google Scholar]
- Gasparri, D., Morelli, L., Ivanov, V. D., et al. 2021, MNRAS, 507, 4669 [Google Scholar]
- Gasparri, D., Morelli, L., Cuomo, V., et al. 2024, MNRAS, 530, 560 [Google Scholar]
- Gilmore, G., & Wyse, R. F. G. 1998, AJ, 116, 748 [NASA ADS] [CrossRef] [Google Scholar]
- Giuricin, G., Marinoni, C., Ceriani, L., & Pisani, A. 2000, ApJ, 543, 178 [NASA ADS] [CrossRef] [Google Scholar]
- González Delgado, R. M., Pérez, E., Cid Fernandes, R., et al. 2014, A&A, 562, A47 [CrossRef] [EDP Sciences] [Google Scholar]
- Hirschmann, M., Naab, T., Ostriker, J. P., et al. 2015, MNRAS, 449, 528 [CrossRef] [Google Scholar]
- Ho, L. C., Li, Z.-Y., Barth, A. J., Seigar, M. S., & Peng, C. Y. 2011, ApJS, 197, 21 [Google Scholar]
- Ibarra-Medel, H., Avila-Reese, V., Lacerna, I., et al. 2022, MNRAS, 510, 5676 [Google Scholar]
- Ivanov, V. D., Rieke, M. J., Engelbracht, C. W., et al. 2004, ApJS, 151, 387 [NASA ADS] [CrossRef] [Google Scholar]
- Jablonka, P., Gorgas, J., & Goudfrooij, P. 2007, A&A, 474, 763 [NASA ADS] [CrossRef] [EDP Sciences] [Google Scholar]
- Konstantopoulos, I. S., Green, A. W., Foster, C., et al. 2015, Astron. Comput., 13, 58 [Google Scholar]
- Kotilainen, J. K., Hyvönen, T., Reunanen, J., & Ivanov, V. D. 2012, MNRAS, 425, 1057 [Google Scholar]
- Kuntschner, H., Emsellem, E., Bacon, R., et al. 2010, MNRAS, 408, 97 [Google Scholar]
- La Barbera, F., Vazdekis, A., Ferreras, I., et al. 2019, MNRAS, 489, 4090 [Google Scholar]
- La Barbera, F., Vazdekis, A., Pasquali, A., et al. 2024, A&A, 687, A156 [NASA ADS] [CrossRef] [EDP Sciences] [Google Scholar]
- Lacerna, I., Ibarra-Medel, H., Avila-Reese, V., et al. 2020, A&A, 644, A117 [NASA ADS] [CrossRef] [EDP Sciences] [Google Scholar]
- Maiolino, R., & Mannucci, F. 2019, A&ARv, 27, 3 [Google Scholar]
- Maraston, C. 2005, MNRAS, 362, 799 [NASA ADS] [CrossRef] [Google Scholar]
- Mármol-Queraltó, E., Cardiel, N., Sánchez-Blázquez, P., et al. 2009, ApJ, 705, L199 [CrossRef] [Google Scholar]
- McDermid, R. M., Alatalo, K., Blitz, L., et al. 2015, MNRAS, 448, 3484 [Google Scholar]
- Méndez-Abreu, J., Aguerri, J. A. L., Barrena, R., et al. 2012, A&A, 537, A25 [NASA ADS] [CrossRef] [EDP Sciences] [Google Scholar]
- Méndez-Abreu, J., Aguerri, J. A. L., Falcón-Barroso, J., et al. 2018, MNRAS, 474, 1307 [NASA ADS] [Google Scholar]
- Mobasher, B., & James, P. A. 1996, MNRAS, 280, 895 [NASA ADS] [CrossRef] [Google Scholar]
- Morelli, L., Pompei, E., Pizzella, A., et al. 2008, MNRAS, 389, 341 [Google Scholar]
- Morelli, L., Corsini, E. M., Pizzella, A., et al. 2012, MNRAS, 423, 962 [NASA ADS] [CrossRef] [Google Scholar]
- Morelli, L., Corsini, E. M., Pizzella, A., et al. 2015, MNRAS, 452, 1128 [NASA ADS] [CrossRef] [Google Scholar]
- Morelli, L., Parmiggiani, M., Corsini, E. M., et al. 2016, MNRAS, 463, 4396 [Google Scholar]
- Morelli, L., Ivanov, V. D., Pizzella, A., et al. 2020, A&A, 641, A44 [NASA ADS] [CrossRef] [EDP Sciences] [Google Scholar]
- Naab, T., Johansson, P. H., & Ostriker, J. P. 2009, ApJ, 699, L178 [Google Scholar]
- Origlia, L., Moorwood, A. F. M., & Oliva, E. 1993, A&A, 280, 536 [NASA ADS] [Google Scholar]
- Oser, L., Ostriker, J. P., Naab, T., Johansson, P. H., & Burkert, A. 2010, ApJ, 725, 2312 [Google Scholar]
- Oyarzún, G. A., Bundy, K., Westfall, K. B., et al. 2019, ApJ, 880, 111 [CrossRef] [Google Scholar]
- Pipino, A., D’Ercole, A., Chiappini, C., & Matteucci, F. 2010, MNRAS, 407, 1347 [NASA ADS] [CrossRef] [Google Scholar]
- Rampazzo, R., Annibali, F., Bressan, A., et al. 2005, A&A, 433, 497 [NASA ADS] [CrossRef] [EDP Sciences] [Google Scholar]
- Rieke, G. H., Lebofsky, M. J., Thompson, R. I., Low, F. J., & Tokunaga, A. T. 1980, ApJ, 238, 24 [NASA ADS] [CrossRef] [Google Scholar]
- Riffel, R., Rodríguez-Ardila, A., Brotherton, M. S., et al. 2019, MNRAS, 486, 3228 [Google Scholar]
- Rubino, M., Pizzella, A., Morelli, L., et al. 2021, A&A, 654, A30 [NASA ADS] [CrossRef] [EDP Sciences] [Google Scholar]
- Saglia, R. P., Bertin, G., Bertola, F., et al. 1993, ApJ, 403, 567 [Google Scholar]
- Sánchez, S. F., Kennicutt, R. C., Gil de Paz, A., et al. 2012, A&A, 538, A8 [Google Scholar]
- Sánchez-Blázquez, P., Gorgas, J., Cardiel, N., & González, J. J. 2006, A&A, 457, 809 [NASA ADS] [CrossRef] [EDP Sciences] [Google Scholar]
- Sánchez-Blázquez, P., Rosales-Ortega, F. F., Méndez-Abreu, J., et al. 2014, A&A, 570, A6 [NASA ADS] [CrossRef] [EDP Sciences] [Google Scholar]
- Sandage, A. 1990, J. R. Astron. Soc. Can., 84, 70 [NASA ADS] [Google Scholar]
- Sarzi, M., Falcón-Barroso, J., Davies, R. L., et al. 2006, MNRAS, 366, 1151 [Google Scholar]
- Sarzi, M., Iodice, E., Coccato, L., et al. 2018, A&A, 616, A121 [NASA ADS] [CrossRef] [EDP Sciences] [Google Scholar]
- Seidel, M. K., Cacho, R., Ruiz-Lara, T., et al. 2015, MNRAS, 446, 2837 [Google Scholar]
- Sharples, R., Bender, R., Agudo Berbel, A., et al. 2013, Messenger, 151, 21 [Google Scholar]
- Silva, D. R., Kuntschner, H., & Lyubenova, M. 2008, ApJ, 674, 194 [Google Scholar]
- Skrutskie, M. F., Cutri, R. M., Stiening, R., et al. 2006, AJ, 131, 1163 [NASA ADS] [CrossRef] [Google Scholar]
- Smette, A., Sana, H., Noll, S., et al. 2015, A&A, 576, A77 [NASA ADS] [CrossRef] [EDP Sciences] [Google Scholar]
- Stephens, A. W., & Frogel, J. A. 2004, AJ, 127, 925 [NASA ADS] [CrossRef] [Google Scholar]
- Temi, P., Brighenti, F., & Mathews, W. G. 2009, ApJ, 707, 890 [Google Scholar]
- Thatte, N., Tecza, M., Schnetler, H., et al. 2021, Messenger, 182, 7 [NASA ADS] [Google Scholar]
- Vazdekis, A., Koleva, M., Ricciardelli, E., Röck, B., & Falcón-Barroso, J. 2016, MNRAS, 463, 3409 [Google Scholar]
- Welch, G. A., & Forrester, W. T. 1972, AJ, 77, 333 [Google Scholar]
- Wilkinson, D. M., Maraston, C., Thomas, D., et al. 2015, MNRAS, 449, 328 [NASA ADS] [CrossRef] [Google Scholar]
- Younis, S., Meaburn, J., & Stewart, P. 1985, A&A, 147, 178 [Google Scholar]
Appendix A: Equivalent widths of the individual CO indices in the H band
KMOS IFU properties and NIR line-strength measurements of the single CO indices in the H band.
EWs in Å of the four radial bins and the central IFU of the CO indices in the H band.
All Tables
KMOS IFU properties and NIR line-strength measurements of the single CO indices in the H band.
EWs in Å of the four radial bins and the central IFU of the CO indices in the H band.
All Figures
|
Fig. 1. V-band isophotal contours of IC 4296 with distribution and ID number of the KMOS IFUs. Red squares are the inner IFUs with S/N > 10 per pixel used to measure the EW of the strongest line-strength indices. Black points are the outer IFUs with lower S/N. The shaded annuli are the radial bins considered to average the IFUs and construct the radial gradients of the line-strength indices. Image courtesy of the Carnegie-Irvine Galaxy Survey (CGS, Ho et al. 2011). |
| In the text | |
|
Fig. 2. Relative variation of the EW of the 13 NIR indices measured in this paper as a function of the S/N for 1000 simulated spectra for each S/N value. Black points represent the single EW for each simulated spectrum. Red points represent the mean values. |
| In the text | |
|
Fig. 3. Correlations between NIR indices and velocity dispersion (upper panel), and between the indices (lower panel), as presented in Figs. 2 and 3 of Gasparri et al. (2021). Red lines represent the best-fitting linear relations derived by the authors, along with the corresponding Pearson correlation coefficients. Sample galaxies are colour-coded by morphological type and in the index-index plots, the symbol sizes are proportional to their central velocity dispersion. The values for IC 4296 are superimposed as a black square. |
| In the text | |
|
Fig. 4. Maps of nine NIR line-strength indices measured within the 13 internal IFUs with S/N > 10 per pixel. EWs are normalised to their central values. Relative variation of ±90% are shown. Black squares indicate no data due to low S/N in the index pseudo-continuum bands. |
| In the text | |
|
Fig. 5. Smoothed spectra for the five radial bins used to analyse the variations of the NIR line-strength indices. The central bands of the measured indices are reported as red shaded areas, as defined in Cesetti et al. (2013) and Morelli et al. (2020). |
| In the text | |
|
Fig. 6. Radial profiles for the four radial bins plus the central value of the nine strongest NIR indices. The red line is the best fit of the data considering the uncertainties. |
| In the text | |
|
Fig. 7. Radial profiles for the five H band CO indices. The red line is the best fit of the data considering the uncertainties. |
| In the text | |
Current usage metrics show cumulative count of Article Views (full-text article views including HTML views, PDF and ePub downloads, according to the available data) and Abstracts Views on Vision4Press platform.
Data correspond to usage on the plateform after 2015. The current usage metrics is available 48-96 hours after online publication and is updated daily on week days.
Initial download of the metrics may take a while.