Fig. 1
Download original image
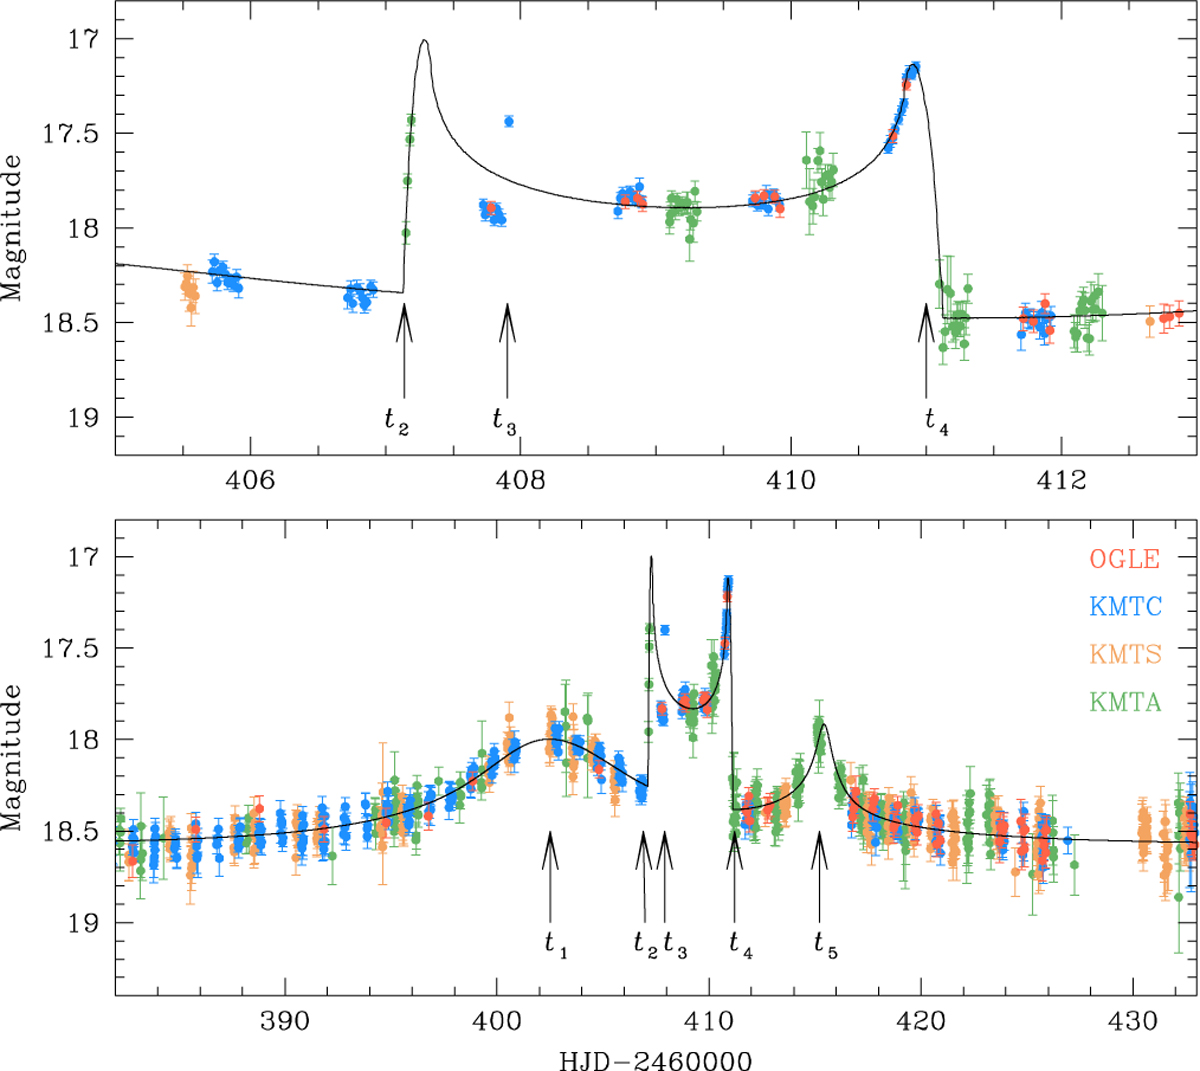
Light curve of the lensing event KMT-2024-BLG-0404. The lower panel presents the overall view, while the upper panel provides a close-up of the caustic-crossing features. The curve overlaid on the data points represents the best-fit 2L1S model, which was derived by excluding data from the interval 407.5 < HJD′ < 408.0. In the lower panel, arrows labeled t1, t2, t3, t4, and t5 mark the positions of specific anomaly features.
Current usage metrics show cumulative count of Article Views (full-text article views including HTML views, PDF and ePub downloads, according to the available data) and Abstracts Views on Vision4Press platform.
Data correspond to usage on the plateform after 2015. The current usage metrics is available 48-96 hours after online publication and is updated daily on week days.
Initial download of the metrics may take a while.