Fig. 2
Download original image
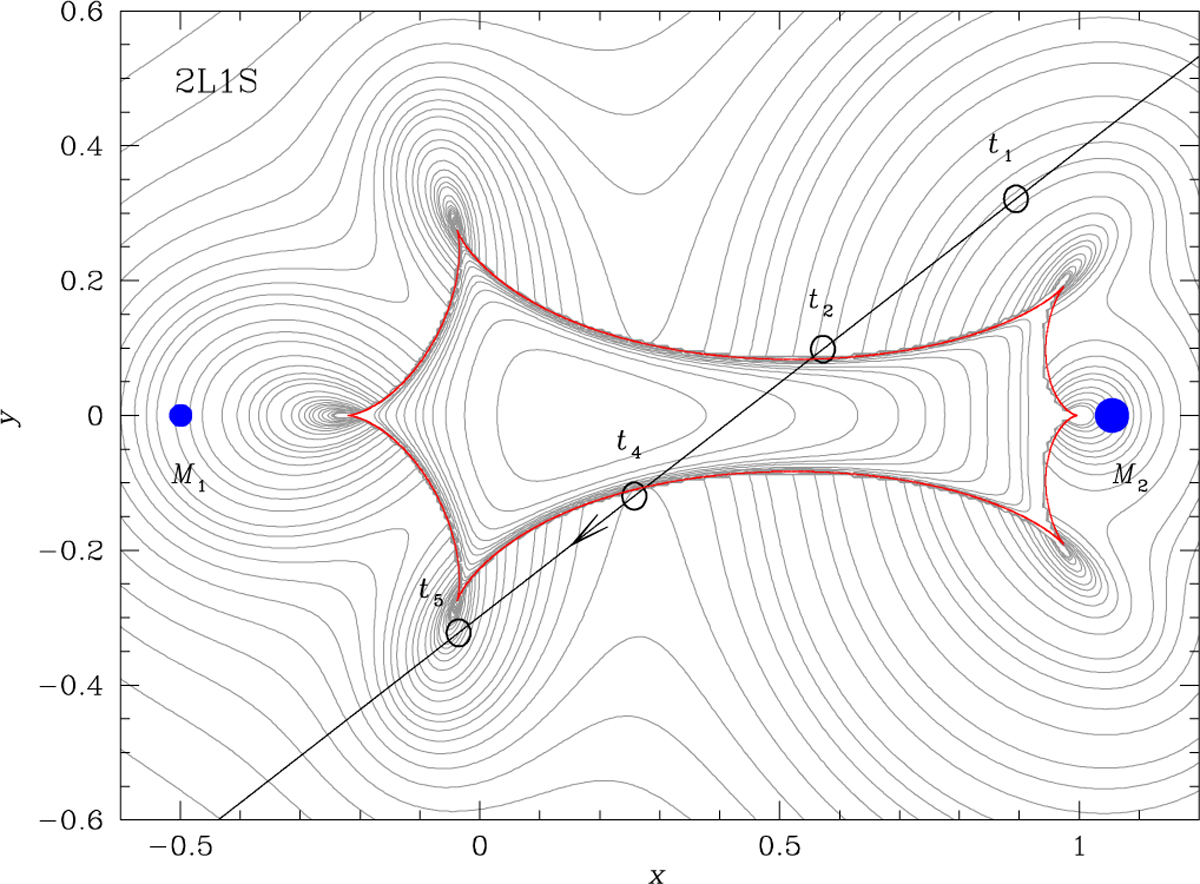
Lens system configuration corresponding to the best-fit 2L1S model. The cuspy closed red figure represents the caustic, while the two blue dots labeled M1 and M2 denote the positions of the binary-lens components. The arrowed line illustrates the trajectory of the source. The four empty circles, scaled to the source size, mark the source positions along its trajectory at the times corresponding to the anomaly features at t1, t2, t4, and t5. The gray curves surrounding the caustic represent the equi-magnification contours.
Current usage metrics show cumulative count of Article Views (full-text article views including HTML views, PDF and ePub downloads, according to the available data) and Abstracts Views on Vision4Press platform.
Data correspond to usage on the plateform after 2015. The current usage metrics is available 48-96 hours after online publication and is updated daily on week days.
Initial download of the metrics may take a while.