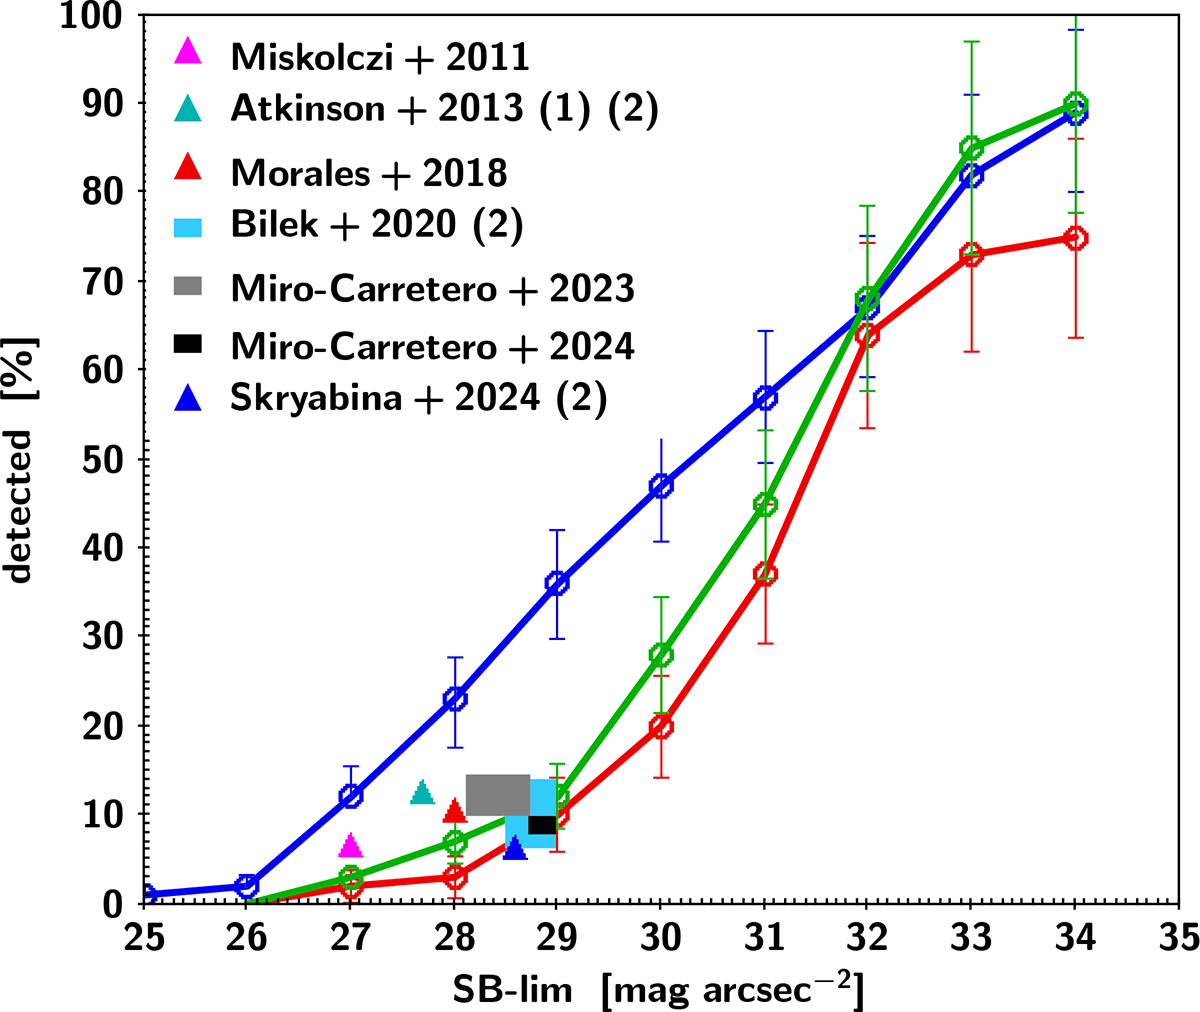
Fig. 10.
Download original image
Stellar stream detection rate, i.e. percentage of galaxies for which at least one stream could be detected as a function of the image surface brightness limit. Continuous lines represent the results for the TNG50 (red), COCO (blue) and AURIGA (green) simulations, with error bars showing the Poisson confidence interval. The plot also shows the results of observational stream surveys from the literature, discussed in Section 7.1. (1) The calculation of the SB limit follows a different method than the one applied in this work. (2) The detection rate has been derived for all LSB features, including streams. For the DES sample (black square symbol), the x and y dimensions of the symbol indicate the dispersion in surface brightness limit of the DES sample and the dispersion in the detection rate according to a binomial distribution, respectively, see Miró-Carretero et al. (2024).
Current usage metrics show cumulative count of Article Views (full-text article views including HTML views, PDF and ePub downloads, according to the available data) and Abstracts Views on Vision4Press platform.
Data correspond to usage on the plateform after 2015. The current usage metrics is available 48-96 hours after online publication and is updated daily on week days.
Initial download of the metrics may take a while.