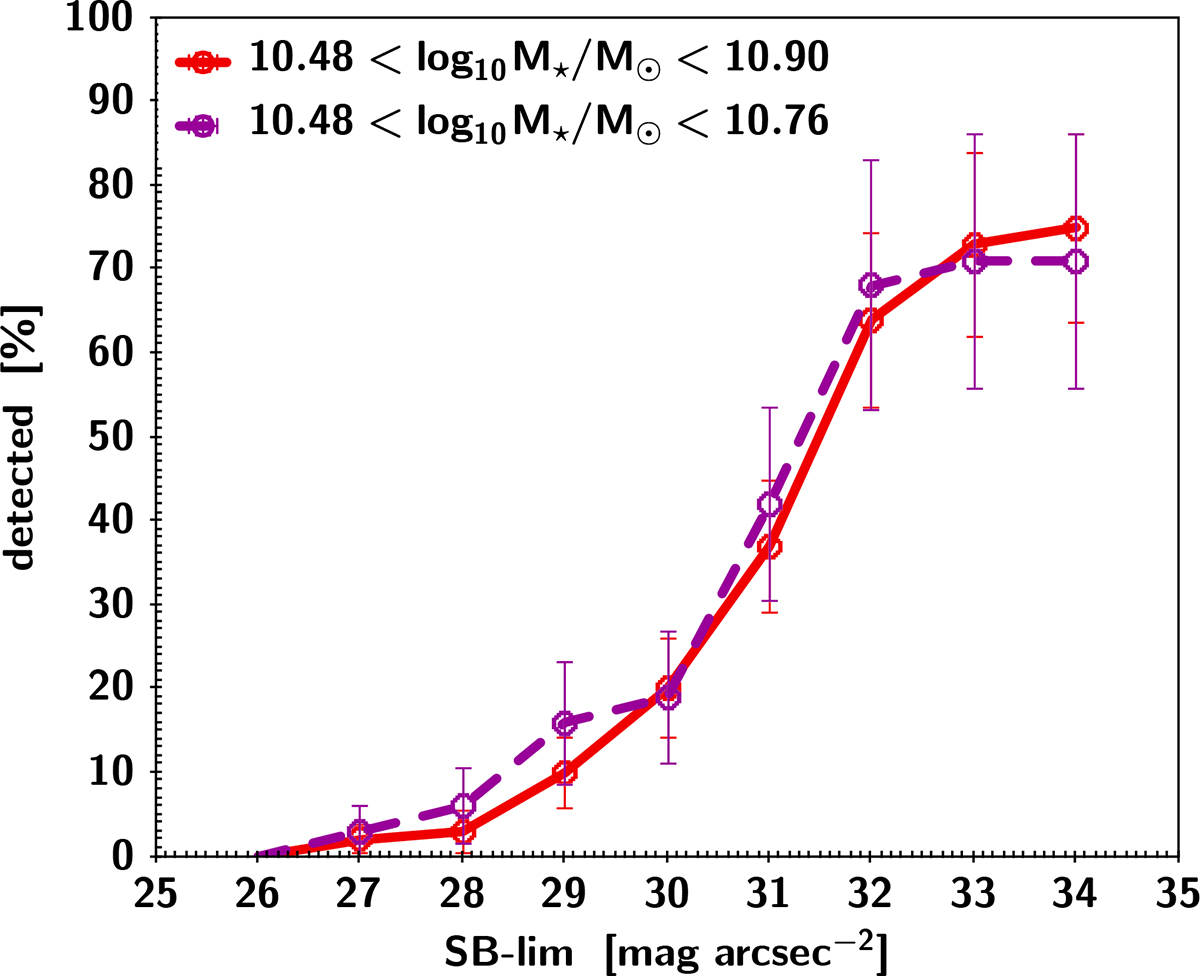
Fig. 12.
Download original image
Stellar streams detection rate as a function of the image surface brightness limit for the TNG50 simulation. The percentage of the streams detected by visual inspection is plotted versus the surface brightness limit at which such detection was possible. The solid line corresponds to a stellar mass range of log10M⋆/M⊙ = 10.48 and log10M⋆/M⊙ = 10.76, while the dashed line corresponds to an extended mass range up to log10M⋆/M⊙ = 10.9.
Current usage metrics show cumulative count of Article Views (full-text article views including HTML views, PDF and ePub downloads, according to the available data) and Abstracts Views on Vision4Press platform.
Data correspond to usage on the plateform after 2015. The current usage metrics is available 48-96 hours after online publication and is updated daily on week days.
Initial download of the metrics may take a while.