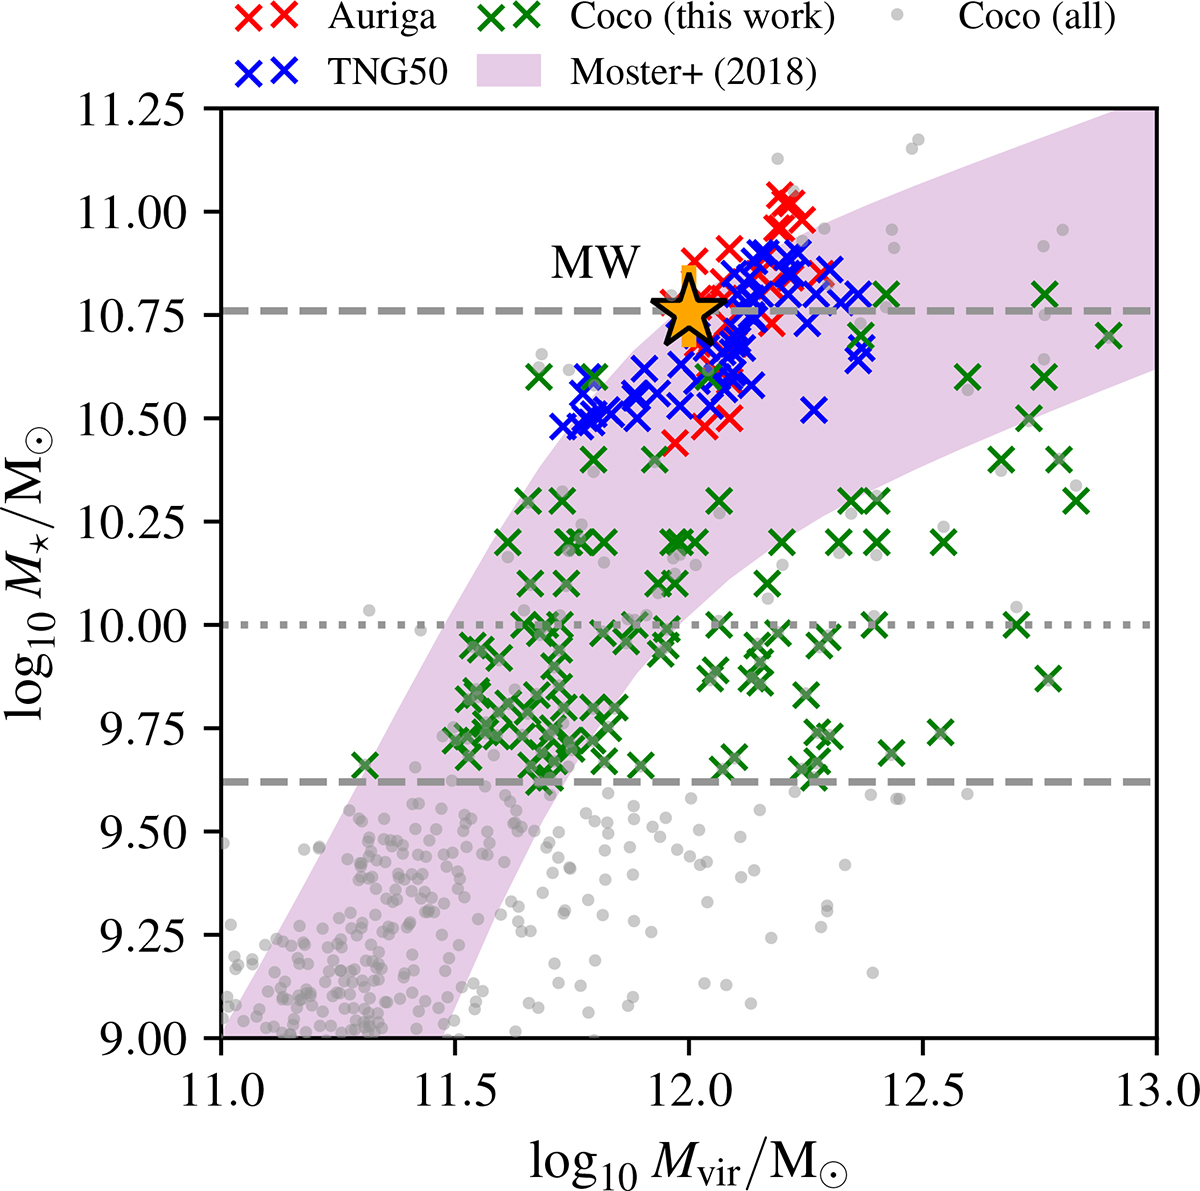
Fig. 5.
Download original image
Stellar mass versus halo mass for the selected sample of galaxies in the COCO, TNG50, and Auriga simulations compared with the empirical correlation by Moster et al. (2018) ±2σ. The horizontal lines indicate the DES galaxy sample stellar mass distribution: mean value (dotted line); mean value −1σ (lower dashed line) and mean value +2σ (upper dashed line). The yellow star represents the MW.
Current usage metrics show cumulative count of Article Views (full-text article views including HTML views, PDF and ePub downloads, according to the available data) and Abstracts Views on Vision4Press platform.
Data correspond to usage on the plateform after 2015. The current usage metrics is available 48-96 hours after online publication and is updated daily on week days.
Initial download of the metrics may take a while.