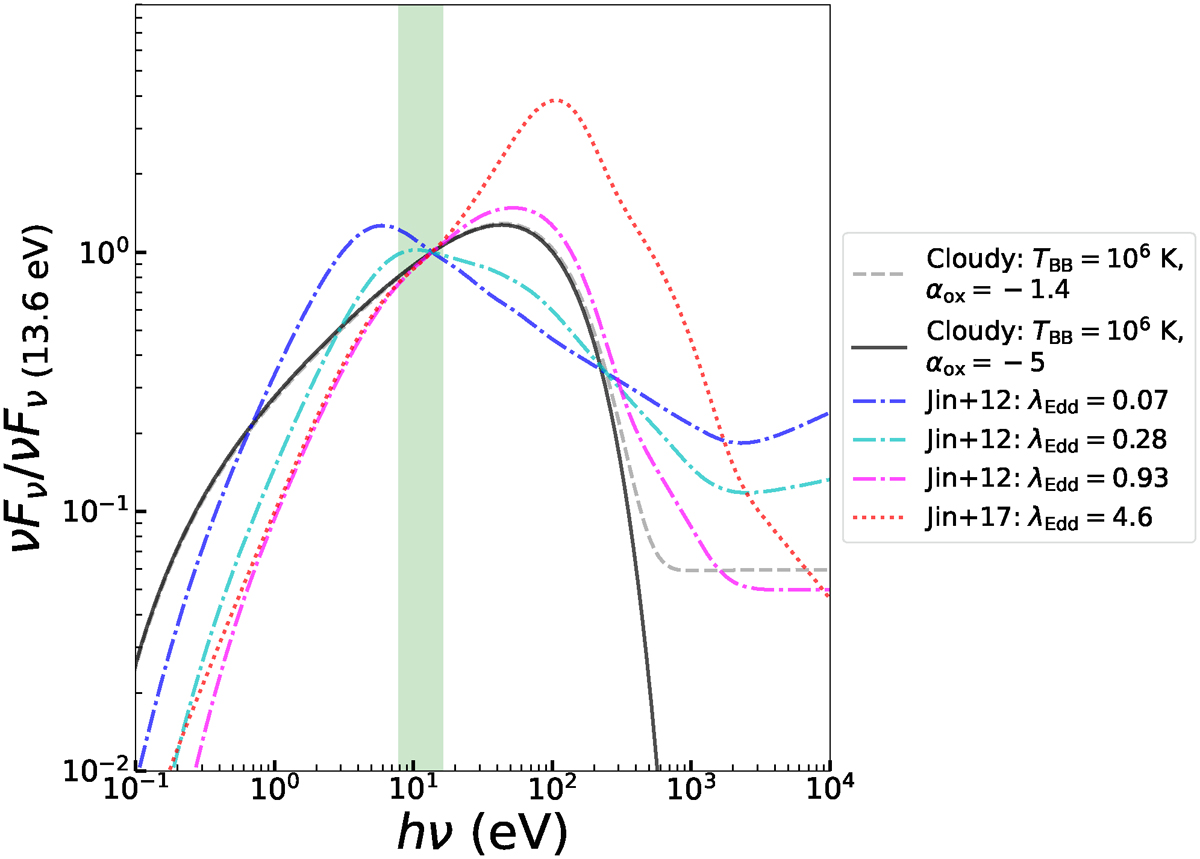
Fig. F.1.
Download original image
Comparison between different input SEDs for CLOUDY photoionisation models. All models are normalised to their fluxes at 1 Ryd. The solid and dashed curves correspond to SEDs constructed from the parametric function in CLOUDY. The dash-dotted and dotted curves are SEDs constructed from observations of AGNs by Jin et al. (2012, 2017). The left edge and the right edge of the shaded region correspond to the ionisation potential of Fe0 and Fe+, respectively.
Current usage metrics show cumulative count of Article Views (full-text article views including HTML views, PDF and ePub downloads, according to the available data) and Abstracts Views on Vision4Press platform.
Data correspond to usage on the plateform after 2015. The current usage metrics is available 48-96 hours after online publication and is updated daily on week days.
Initial download of the metrics may take a while.