Fig. 3.
Download original image
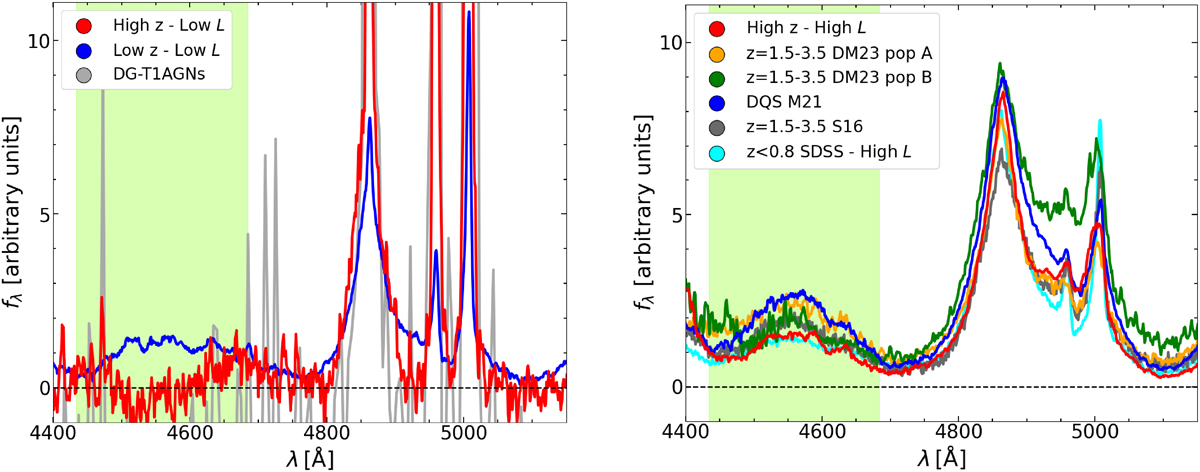
Continuum-subtracted spectral composites of the low-luminosity (left) and high-luminosity (right) subsamples. The Hβand [O III] narrow components have been cut for visualisation purposes. In the right panel we also show the composite quasar spectra for the high-luminosity subsamples. In the case of the Deconto-Machado et al. (2023) sample we built different composite spectra for the Pop A and Pop B sub-samples, which occupy different regions of the EV1 plane. The iron bump between 4434–4684 Å (green shaded area) is evidently weaker in the JWST low-luminosity sample than in the local AGNs. Although the strength of the Fe II bump seemingly varies among the sub-samples, the RFe of the quasars at the epoch of reionisation analysed here is not significantly different from those estimated at lower z as also shown in Table 2.
Current usage metrics show cumulative count of Article Views (full-text article views including HTML views, PDF and ePub downloads, according to the available data) and Abstracts Views on Vision4Press platform.
Data correspond to usage on the plateform after 2015. The current usage metrics is available 48-96 hours after online publication and is updated daily on week days.
Initial download of the metrics may take a while.