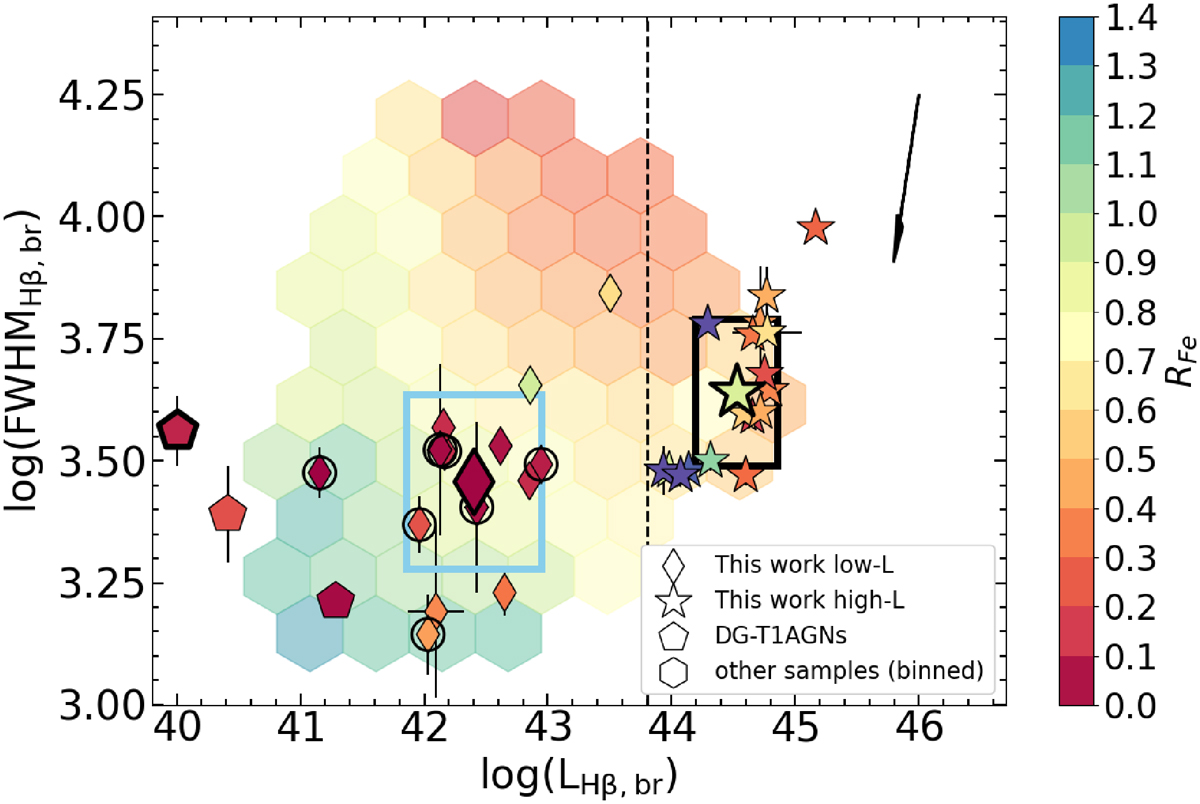
Fig. 4.
Download original image
RFe-log(FWHMHβ, br)−log(LHβ, br) plane. Specifically, he have log(FWHMHβ, br) versus log(LHβ, br) colour-coded by RFe. Objects marked with a circle represent RFe upper limits as defined in the text. The background 2D histogram is obtained by binning the control sample (with a minimum of 30 objects per bin); individual objects from JWST are colour-coded with the same scale in RFe. Due to the large number of upper limits in the low-luminosity region, we also include the values derived from the composite spectra as symbols with thicker black edges. The coloured rectangles mark the regions where the control samples were drawn. The black solid arrow marks the direction of the PCA, as described in Sect. 5.2. SBS_0335-052E (black thick edge pentagon) has been shifted for a tighter image layout.
Current usage metrics show cumulative count of Article Views (full-text article views including HTML views, PDF and ePub downloads, according to the available data) and Abstracts Views on Vision4Press platform.
Data correspond to usage on the plateform after 2015. The current usage metrics is available 48-96 hours after online publication and is updated daily on week days.
Initial download of the metrics may take a while.