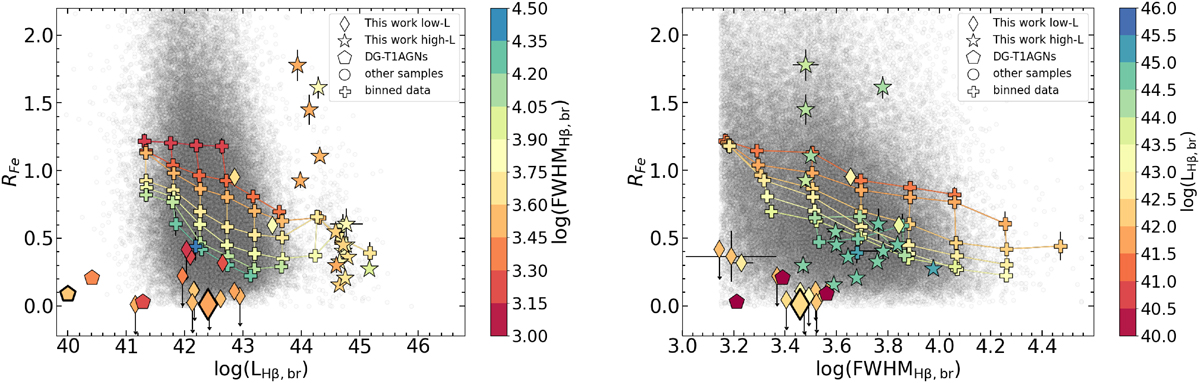
Fig. 5.
Download original image
Orthogonal sections of the log(FWHMHβ,br)−log(LHβ,br)−RFe parameter space. Specifically we have (left) RFe versus log(LHβ, br) in (colour-coded) bins of FWHMHβ,br, and (right) RFe versus FWHMHβ,br in (colour-coded) bins of log(LHβ, br). The thick-edged diamond and star represent the values derived from the composite spectra. The colour-coded lines represent the third quantity evaluated on the binned sources of the control samples. SBS_0335-052E (black thick edge pentagon) has been shifted for a tighter image layout. It is clear that, while the high-luminosity objects of the sample reside – albeit with some scatter – in the expected locus of the parameter space according to the control sample, the low-luminosity objects exhibit far lower RFe. Interestingly, two low-luminosity objects (JADES-029777 and XID2028) detach from the bulk of the faint sample, being close to the RFe expected. As we discuss further in Sect. 5.5, these are the two only faint AGNs that are X-ray detected.
Current usage metrics show cumulative count of Article Views (full-text article views including HTML views, PDF and ePub downloads, according to the available data) and Abstracts Views on Vision4Press platform.
Data correspond to usage on the plateform after 2015. The current usage metrics is available 48-96 hours after online publication and is updated daily on week days.
Initial download of the metrics may take a while.