Open Access
Fig. B.2
Download original image
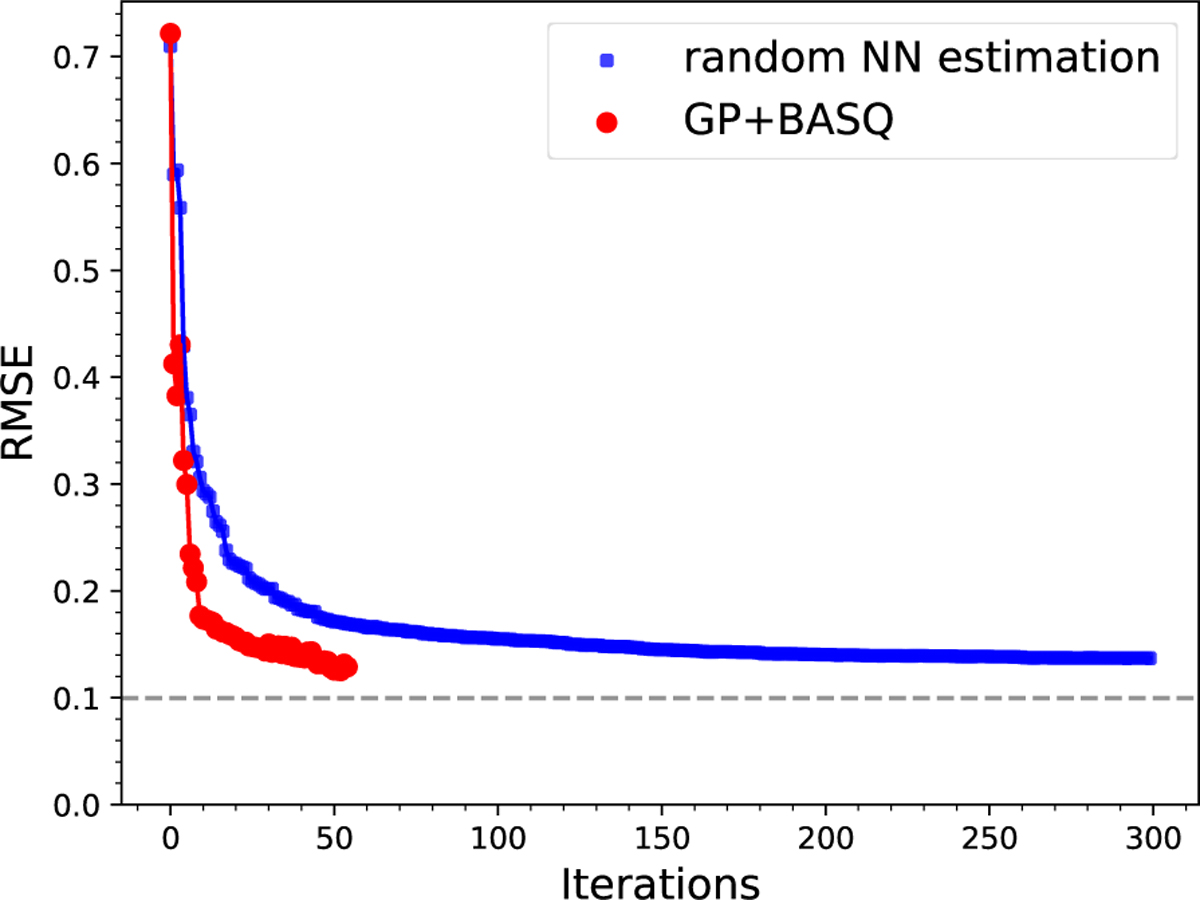
RMSE as a function of iteration number for NN estimation and the GP model plus BASQ algorithm in reconstructing the parameter maps in Fig. B. The horizontal dashed line indicates the minimum achievable RMSE, resulting from noisy fitting at individual locations.
Current usage metrics show cumulative count of Article Views (full-text article views including HTML views, PDF and ePub downloads, according to the available data) and Abstracts Views on Vision4Press platform.
Data correspond to usage on the plateform after 2015. The current usage metrics is available 48-96 hours after online publication and is updated daily on week days.
Initial download of the metrics may take a while.