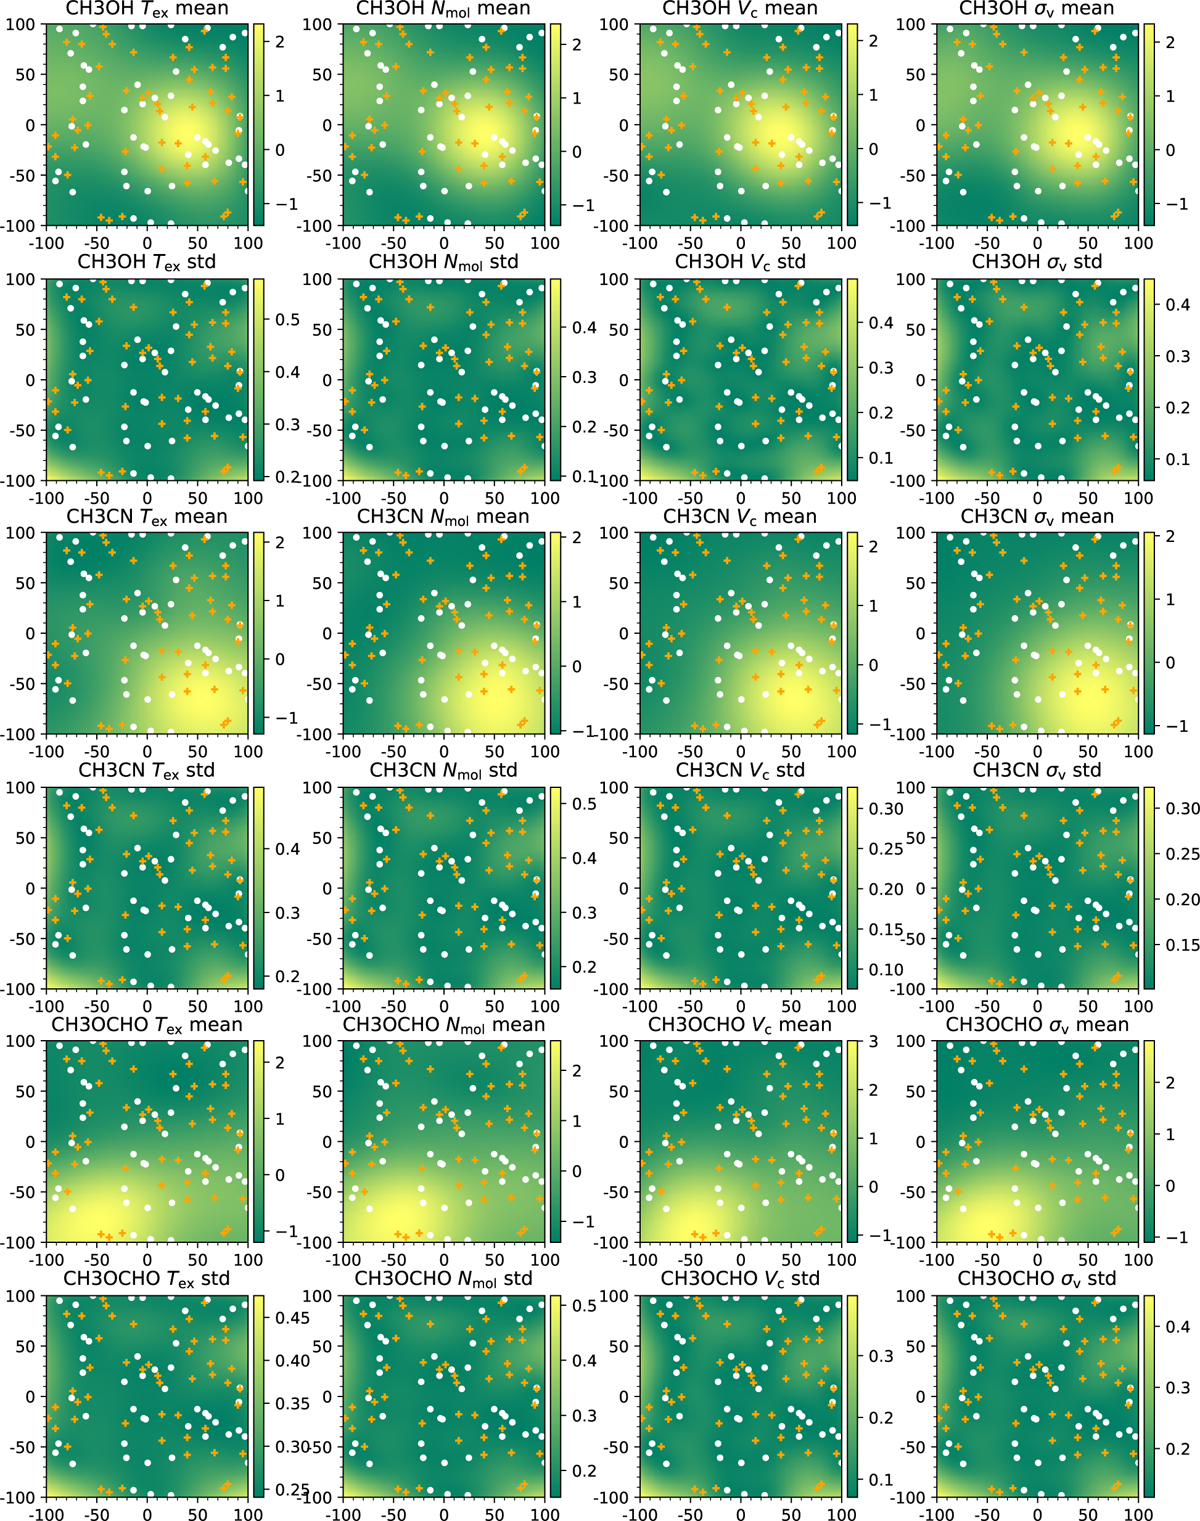
Fig. 7
Download original image
First-iteration results of multi-output GP model predictions and predicted standard deviations for the four parameters, Tex, Nmol, Vc, and σv, after SVI fitting to 50 initially randomly selected positions and model training. The white dots mark the locations where the SVI fitting is conducted, and the orange pluses indicate the proposed next-iteration locations to be queried, as suggested by the BASQ method.
Current usage metrics show cumulative count of Article Views (full-text article views including HTML views, PDF and ePub downloads, according to the available data) and Abstracts Views on Vision4Press platform.
Data correspond to usage on the plateform after 2015. The current usage metrics is available 48-96 hours after online publication and is updated daily on week days.
Initial download of the metrics may take a while.