Open Access
Fig. 8
Download original image
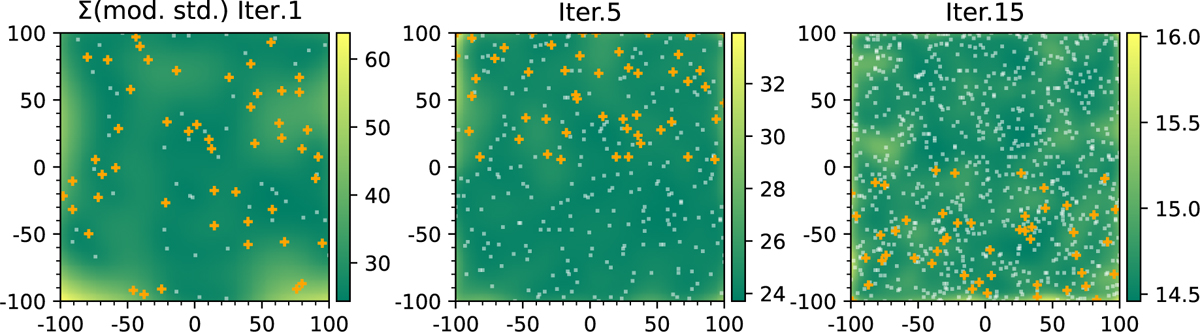
Sum of the GP model’s predictive variances across all parameter maps, after the first, fifth, and fifteenth iteration of training. The white dots indicate the queried locations, while the orange pluses indicate the next-iteration locations proposed by the GP model.
Current usage metrics show cumulative count of Article Views (full-text article views including HTML views, PDF and ePub downloads, according to the available data) and Abstracts Views on Vision4Press platform.
Data correspond to usage on the plateform after 2015. The current usage metrics is available 48-96 hours after online publication and is updated daily on week days.
Initial download of the metrics may take a while.