Fig. 9
Download original image
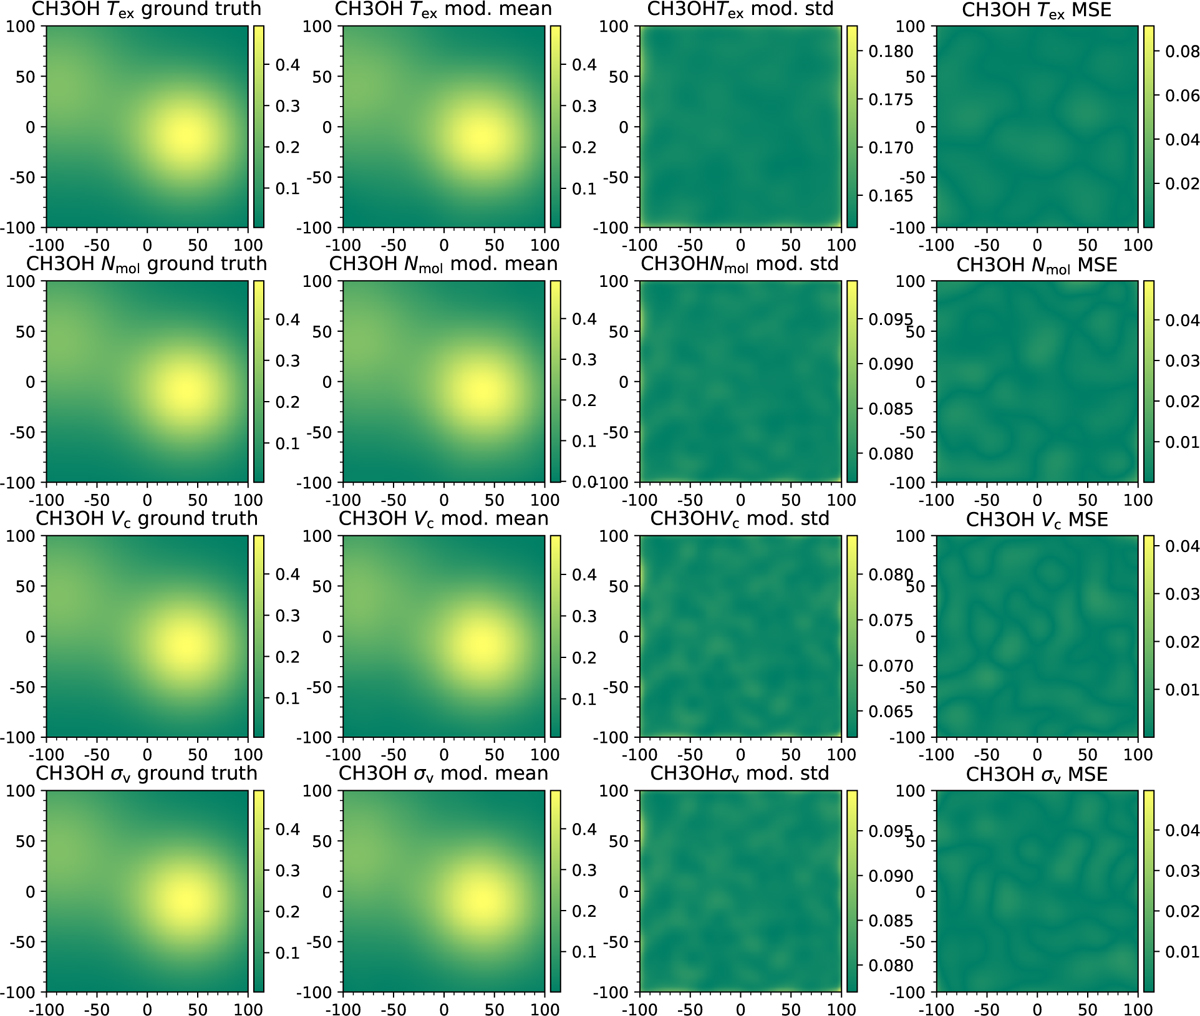
Comparison between the ground truth and GP model-predicted parameter distributions after 18 iterations for CH3OH. The two left panels show the ground truth and GP model-predicted mean distributions on the same color scale. The two right panels show the standard deviation of the model predictions and the MSE between the ground truth and model predictions. The maximum color scale for the MSE is set to 0.5 times the maximum value of the standard deviation of the model predictions.
Current usage metrics show cumulative count of Article Views (full-text article views including HTML views, PDF and ePub downloads, according to the available data) and Abstracts Views on Vision4Press platform.
Data correspond to usage on the plateform after 2015. The current usage metrics is available 48-96 hours after online publication and is updated daily on week days.
Initial download of the metrics may take a while.