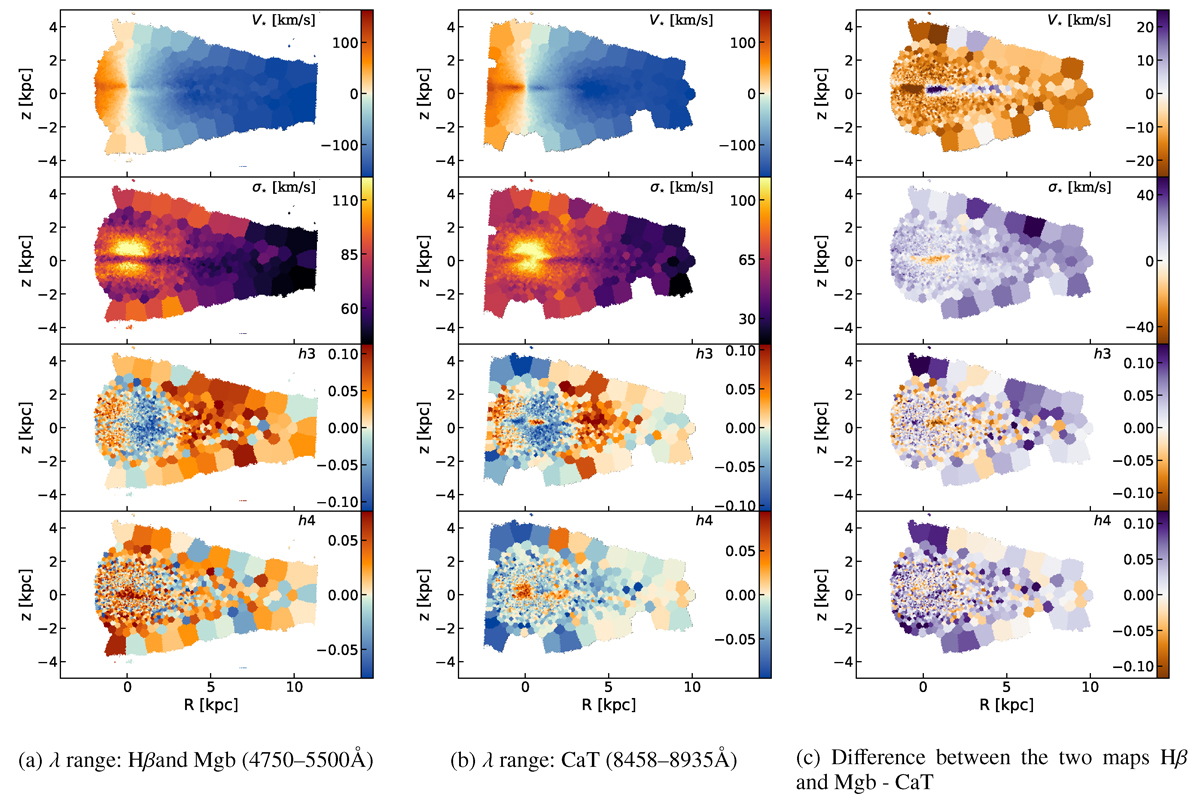
Fig. E.1.
Download original image
Stellar velocity (top row), velocity dispersion (second row), h3 (third row), and h4 (fourth row) for GECKOS galaxy IC1711 calculated over the wavelength ranges of Hβ and Mgb (4750–5500 Å; first column), and the CaT (8458–8935Å, middle column) binned to SN = 100. The right column shows the difference between the two. The most obvious feature is seen at the centres of the V⋆ and h3 maps; evidence for a nuclear disc is seen in the CaT maps, but is absent (and presumably hidden by the dust lane) in the Hβ maps.
Current usage metrics show cumulative count of Article Views (full-text article views including HTML views, PDF and ePub downloads, according to the available data) and Abstracts Views on Vision4Press platform.
Data correspond to usage on the plateform after 2015. The current usage metrics is available 48-96 hours after online publication and is updated daily on week days.
Initial download of the metrics may take a while.