Fig. C.4.
Download original image
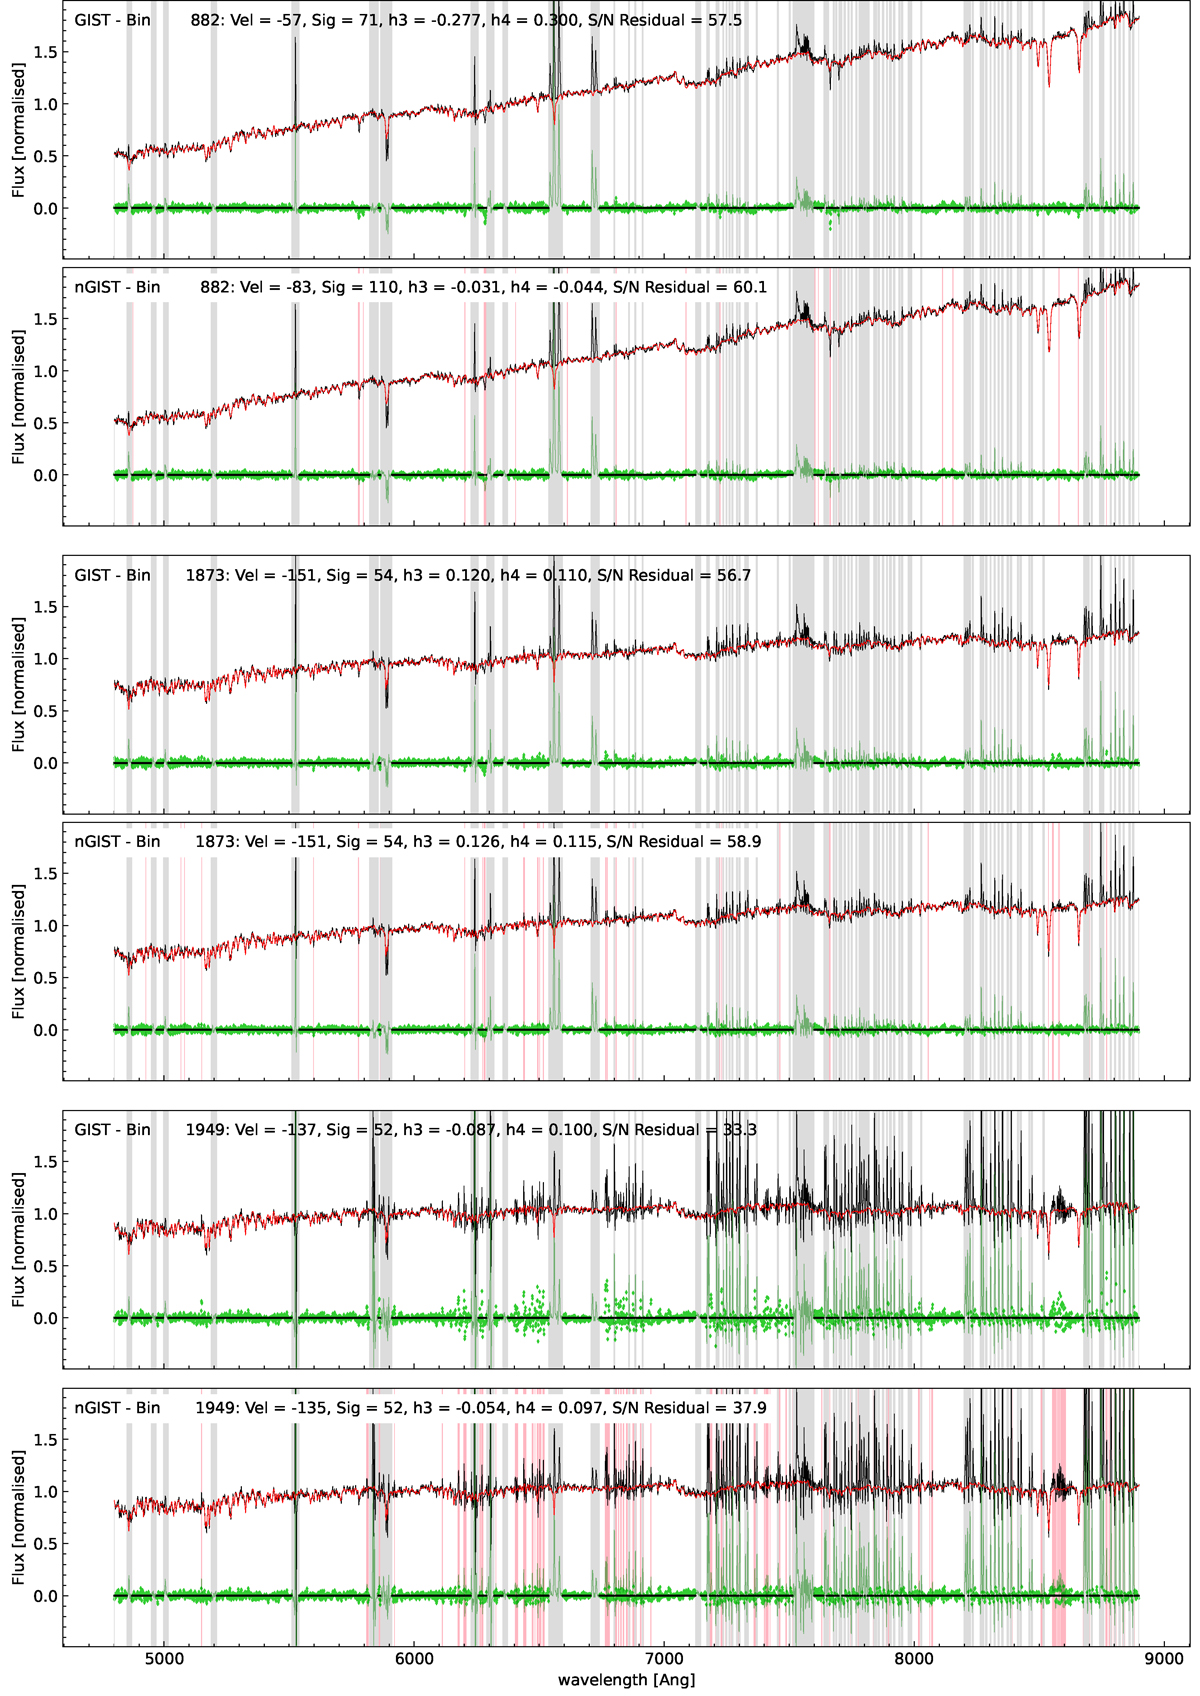
Comparison of the masking and subsequent PPXF best-fit for three Voronoi bins of the GIST (top) and NGIST (bottom) fits shown in Figures A.2 and A.3. In each case the original spectrum of the bin is shown as a black line. The emission and sky line masks provided to PPXF are shown as the shaded grey regions. NGIST additionally performs further cleaning of the spectra, and these additional clipped regions are shown as shaded red regions. The best fit to the stellar continuum is shown in red, and the residuals in green. The derived stellar kinematic parameters for each spectrum are also listed.
Current usage metrics show cumulative count of Article Views (full-text article views including HTML views, PDF and ePub downloads, according to the available data) and Abstracts Views on Vision4Press platform.
Data correspond to usage on the plateform after 2015. The current usage metrics is available 48-96 hours after online publication and is updated daily on week days.
Initial download of the metrics may take a while.