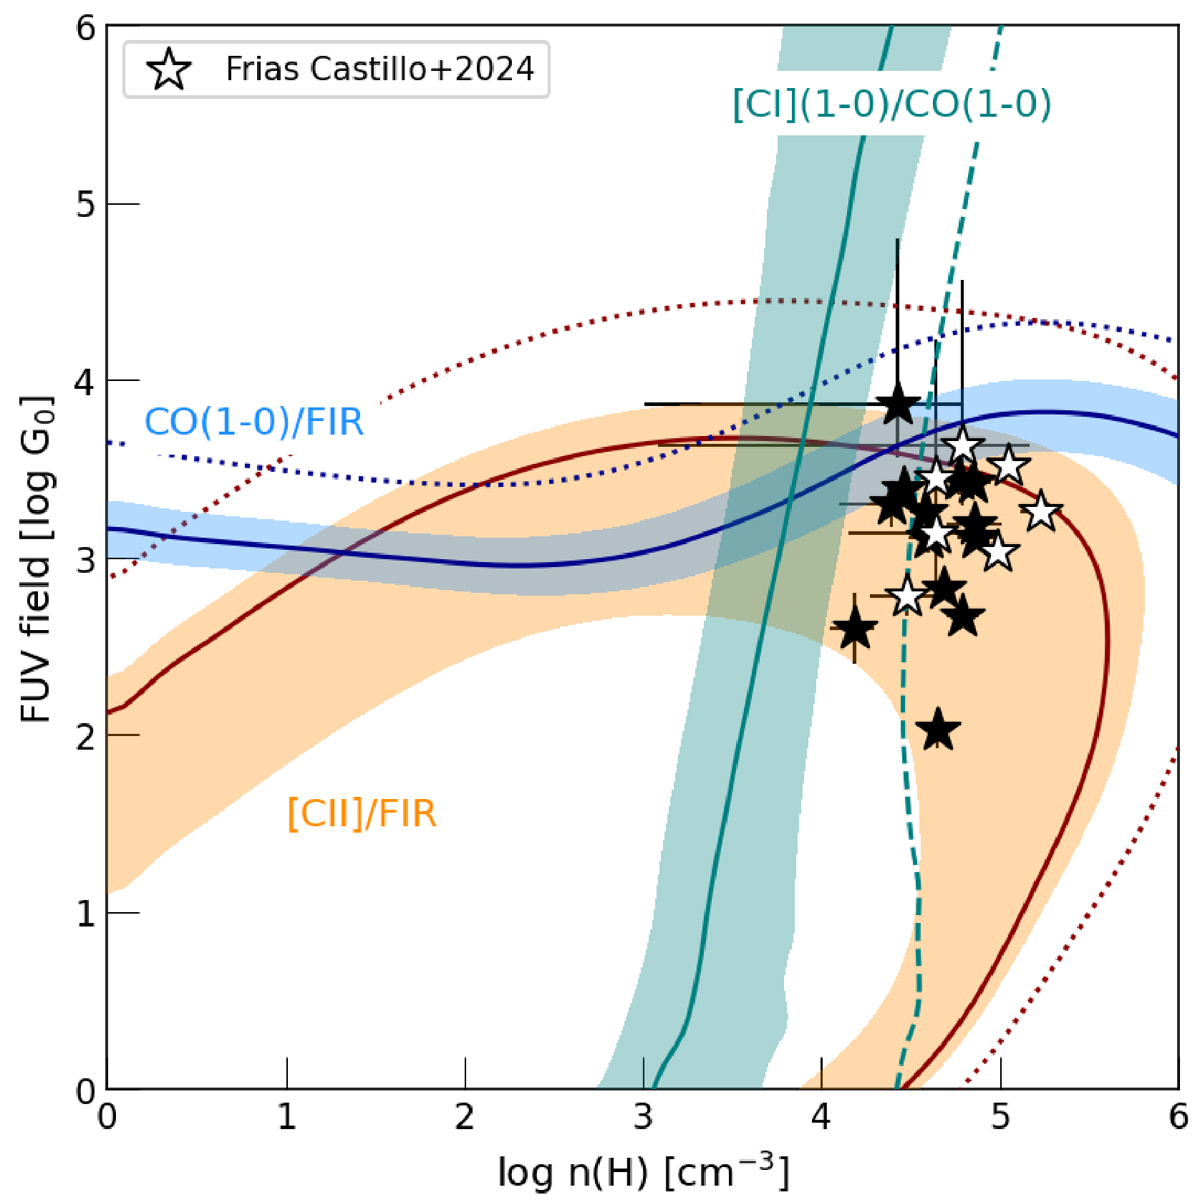
Fig. 4.
Download original image
PDR model for the extended CO(1–0) reservoirs compared to source-averaged models for DSFGs from the AS2VLA sample from Frias Castillo et al. (2025, stars). The sources from Frias Castillo et al. (2025) that are part of our sample are indicated by solid symbols, and those that are not are shown with open symbols. In addition to our CO(1–0) stacked data, we used [C II] and far-IR continuum from the literature (see main text for details). The dotted blue line corresponds to CO(1–0) being suppressed by 50% due to elevated CMB background. The dashed red line corresponds to 20% [C II] arising from the PDRs (as opposed to the fiducial value of 80%). The line and continuum ratios are consistent with an elevated density (n = 104.4 ± 0.4 cm−3) and a high far-UV illumination (G = 103.4 ± 0.4G0), indicating they originate in dense, star-forming regions, rather than in a diffuse, quiescent gas.
Current usage metrics show cumulative count of Article Views (full-text article views including HTML views, PDF and ePub downloads, according to the available data) and Abstracts Views on Vision4Press platform.
Data correspond to usage on the plateform after 2015. The current usage metrics is available 48-96 hours after online publication and is updated daily on week days.
Initial download of the metrics may take a while.