| Issue |
A&A
Volume 700, August 2025
|
|
|---|---|---|
| Article Number | A278 | |
| Number of page(s) | 9 | |
| Section | Extragalactic astronomy | |
| DOI | https://doi.org/10.1051/0004-6361/202452948 | |
| Published online | 26 August 2025 | |
CO(1–0) imaging reveals 10-kiloparsec molecular gas reservoirs around star-forming galaxies at high redshift
1
Leiden Observatory, Leiden University, P.O. Box 9513 2300 RA Leiden, The Netherlands
2
Faculty of Electrical Engineering, Mathematics and Computer Science, Delft University of Technology, Mekelweg 4, 2628 CD Delft, The Netherlands
3
SRON – Netherlands Institute for Space Research, Niels Bohrweg 4, 2333 CA Leiden, The Netherlands
4
Centre for Extragalactic Astronomy, Department of Physics, Durham University, South Road, Durham DH1 3LE, UK
5
German Aerospace Center (DLR), Institute of Communications and Navigation, Wessling, Germany
6
European Southern Observatory (ESO), Karl-Schwarzschild-Straße 2 85748 Garching bei München, Germany
7
Department of Physics and Atmospheric Science, Dalhousie University, Halifax, NS B3H 4R2, Canada
8
Academia Sinica Institute of Astronomy and Astrophysics (ASIAA), No. 1, Section 4, Roosevelt Road, Taipei 106216, Taiwan
9
International Centre for Radio Astronomy Research, University of Western Australia, 7 Fairway, Crawley, Perth, Australia
10
ARC Centre of Excellence for All Sky Astrophysics in 3 Dimensions (ASTRO 3D), Australia
11
Instituto de Astrofísica de Canarias, Vía Láctea, 39020 La Laguna (Tenerife), Spain
12
Instituto de Radioastronomía y Astrofísica, Universidad Nacional Autónoma de México, Antigua Carretera a Pátzcuaro # 8701, Ex-Hda. San José de la Huerta, Morelia, Michoacán C.P. 58089, Mexico
13
Cosmic Dawn Center (DAWN), København, Denmark
14
National Radio Astronomy Observatory, Charlottesville, VA, USA
15
Department of Physics and Astronomy, University of British Columbia, 6224 Agricultural Road, Vancouver, BC V6T 1Z1, Canada
16
Max–Planck Institut für Astronomie, Königstuhl 17, 69117 Heidelberg, Germany
⋆ Corresponding author: This email address is being protected from spambots. You need JavaScript enabled to view it.
Received:
10
November
2024
Accepted:
22
June
2025
Abstract
Massive star-forming galaxies at high redshift require a supply of molecular gas from their gas reservoirs that is replenished by infall from the surrounding circumgalactic medium to sustain their immense star formation rates. Our knowledge of the extent and morphology of cold-gas reservoirs of early galaxies is still in its infancy, however. We present the results of stacking more than 80 hours of JVLA observations of CO(1–0) emission, which traces the cold molecular gas, in 19 z = 2.0 − 4.5 dusty star-forming galaxies from the AS2VLA survey. The visibility-plane stack reveals extended emission with a half-light radius of 3.8 ± 0.5 kpc, which is a factor of 2–3 more extended than the dust-obscured star formation and 1.4 ± 0.2× more extended than the stellar emission revealed by the JWST. Stacking the [C I](1–0) observations for 10 galaxies from our parent sample yielded a half-light radius ≤2.6 kpc, which is marginally smaller than CO(1–0). The CO(1–0) size is also comparable to that of the [C II] haloes detected around high-redshift star-forming galaxies. This suggests that these arise from molecular gas. Photo-dissociation region modelling indicates that the extended CO(1–0) emission arises from clumpy dense clouds and not from smooth diffuse gas. Our results show that the bulk (up to 80%) of the molecular gas in these galaxies resides outside the star-forming region with only a small part directly contributing to the star formation.
Key words: galaxies: high-redshift / galaxies: ISM / submillimeter: galaxies
© The Authors 2025
 Open Access article, published by EDP Sciences, under the terms of the Creative Commons Attribution License (https://creativecommons.org/licenses/by/4.0), which permits unrestricted use, distribution, and reproduction in any medium, provided the original work is properly cited.
This article is published in open access under the Subscribe to Open model. This email address is being protected from spambots. You need JavaScript enabled to view it. to support open access publication.
1. Introduction
The majority of the star formation beyond redshift z ≈ 1 took place in massive dusty star-forming galaxies (DSFGs1) with star formation rates (SFRs) of a few 100–1000 M⊙ yr−1 (e.g. Magnelli et al. 2011; Dudzevičiūtė et al. 2020; Zavala et al. 2021). While some DSFGs are starbursts that were triggered by major mergers, many DSFGs appear to be relatively isolated (Gillman et al. 2024; Hodge et al. 2025). The immense SFRs of these isolated galaxies need to be fed by a continuous supply of cold gas from their extended gas reservoirs and the surrounding circumgalactic medium (e.g. Tumlinson et al. 2017; Faucher-Giguère & Oh 2023) or by minor mergers with gas-rich satellites (e.g. Narayanan et al. 2015).
In local galaxies, cold molecular gas is primarily traced by the CO(1–0) rotational line, which has an excitation temperature of just 5.5 K and a critical density of 2 × 103 cm−3. At high redshift, studies of molecular gas have mostly focused on higher-excitation CO rotational emission lines (see, e.g. Hodge & da Cunha 2020; Tacconi et al. 2020; Walter et al. 2020; Birkin et al. 2021). However, these medium- and high-excitation CO emission lines arise from the denser warmer gas, and are expected to be much more compact than the ground-state CO(1–0) transition (e.g. Leroy et al. 2009; Ivison et al. 2011; Emonts et al. 2016). This makes them unsuitable as tracers of cold diffuse gas.
In contrast to the higher-excitation CO lines, studies of the ground-state CO(1–0) line in high-redshift galaxies have been scarce and largely focused on the few brightest sources. The reason for this is the low intrinsic brightness of the CO(1–0) line, which requires a large collecting area and long integrating times to achieve the necessary signal-to-noise ratio (S/N).
The CO(1–0) emission in a number of high-redshift galaxies has been observed by the Green Bank Telescope (e.g. Hainline et al. 2006; Swinbank et al. 2010; Frayer et al. 2011, 2018; Harris et al. 2012; Harrington et al. 2021). These spatially unresolved observations did not provide any information about the source size, however. Early Karl. G. Jansky Very Large Array (JVLA) studies of CO(1–0) emission in bright high-redshift DSFGs (e.g. Ivison et al. 2010, 2011; Riechers et al. 2011a; Thomson et al. 2012) reported half-light radii ranging from a few kiloparsec to ≈25 kpc (J02399–0136, Thomson et al. 2012; Frayer et al. 2018), often showing multiple CO(1–0) components. Some of these results have been challenged by deeper observations, however. For example, Frias Castillo et al. (2022) showed that the supposedly extended CO(1–0) reservoir with high-velocity wings in the z ≈ 3.4 galaxy J13120+4242 (Riechers et al. 2011b) is likely an artefact of the low S/N of the original data. To summarise, the sizes of CO(1–0) reservoirs reported by these early studies might be biased towards the brightest (i.e. most extreme) sources, and their S/N may be low.
More recently, apparently very extended molecular gas reservoirs have been reported in high-density environments of early protoclusters, such as the Spiderweb (z ≈ 2.2, Emonts et al. 2016; Dannerbauer et al. 2017; Jin et al. 2021) which shows a CO(1–0) reservoirs with a half-light radius of R1/2 ≈ 30 kpc CO(1–0), the ≈40-kpc CO(4–3) emission around the z ≈ 3.4 star-forming galaxy from Ginolfi et al. (2017), or the claimed super-extended ≈200 kpc CO(3–2) emission around a z = 2.2 quasar cid_346 (Cicone et al. 2021), which was not confirmed with deeper data, however (Jones et al. 2023).
Further evidence for extended gas around high-redshift DSFGs comes from Atacama Large (Sub)Millimetre Array (ALMA) observations of the [C II] 158 μm line. Extended [C II] haloes have been observed around high-redshift DSFGs (e.g. Gullberg et al. 2018; Rybak et al. 2019, 2020) as well as around less massive star-forming galaxies (e.g. Fujimoto et al. 2019, 2020; Ginolfi et al. 2020; Ikeda et al. 2025), sometimes on scales as large as 50 kpc.
The nature of the [C II] haloes is still contested. They might be low-mass satellite galaxies, outflows from the central galaxy (e.g., Pizzati et al. 2020, 2023), or incoming streams of cold molecular gas. In particular, it is difficult to interpret the [C II] observation because the [C II] 158-μm emission arises from all gas phases (molecular, i.e. H2, atomic, i.e. H0, and ionised, i.e. H+) and not just from the molecular phase.
The ground-state CO(1–0) emission line remains the most robust probe of diffuse molecular gas. Systematic surveys of CO(1–0) in high-redshift DSFGs have recently been conducted using JVLA (Frias Castillo et al. 2023; Stanley et al. 2023). They yielded tentative evidence for extended CO(1–0) emission. Frias Castillo et al. (2023) found that the CO(1–0) extracted from moment-0 maps increases with the aperture size out to radii of ≈5″ (40 kpc). Similarly, using ≈1″ resolution JVLA imaging of 14 galaxies from the z-GAL survey (Cox et al. 2023), Stanley et al. (2023) found CO(1–0) reservoirs with diameters up to 25 kpc. Because about 50% of the Stanley et al. (2023) sources are gravitationally lensed, however, the interpretation of the measured source sizes is not straightforward.
We report the results of stacking 84 hours of CO(1–0) observations from the recently completed AS2VLA2 survey (Frias Castillo et al. 2023). Specifically, using the JVLA in the most compact D array and aiming at a high surface brightness sensitivity provides the ideal set-up for studying potentially very extended cold-gas reservoirs with a low surface brightness around high-redshift DSFGs.
This paper is structured as follows: In Section 2 we describe our sample selection, the observation details, and the visibility-plane analysis and stacking procedure. We then search for potential cold-gas outflows (Section 3.1), present the ancillary [C I](1–0) data, and use PDR modelling to infer the thermodynamics of extended gas reservoirs (Section 3.3). Finally, we compare our inferred CO(1–0) sizes to observations of dust, [C II], and stellar emission (Sections 4.1 and 4.2) and to predictions from hydrodynamical simulations (Section 4.3). Throughout this paper, we assume a standard flat ΛCDM cosmology with H0 = 67.8 km s−1 Mpc−1, ΩM = 0.310, and ΩΛ = 0.690 (Planck Collaboration XIII 2016).
2. Observations and imaging
2.1. Target sample
Our initial sample consisted of 30 sub-millimetre selected star-forming galaxies at z = 2.2 − 4.4 from the AS2VLA survey (Frias Castillo et al. 2023, Paper I). The sample was selected from ALMA continuum detections of sources taken from ≈4 deg2 of SCUBA-2 850 μm maps from the S2CLS (Geach et al. 2017) and S2COSMOS (Simpson et al. 2019) surveys. Individual sources were pin-pointed in high-resolution ALMA and SMA imaging (Stach et al. 2018; Hill et al. 2018; Simpson et al. 2020); the 870-μm fluxes range between 7.5 and 18.3 mJy. All sources have spectroscopic redshifts based on mid-J CO lines and [C I](1–0) (Birkin et al. 2021; Chen et al. 2022; Chapman et al., in prep.). The sources span a stellar mass of M⋆ = (5 − 70)×1010 M⊙ and SFR = 400–1700 M⊙ yr−1, with a median SFR of 1010 M⊙ yr−1 (Frias Castillo et al. 2023; Liao et al. 2024). M⋆ and SFR were derived by Dudzevičiūtė et al. (2020), Simpson et al. (2020) using the high-redshift version of the spectral energy distribution modelling code MAGPHYS (da Cunha et al. 2015; Battisti et al. 2019). Further follow-up included ALMA imaging of the [C I](1–0) (Frias Castillo et al. 2025) and high-excitation CO lines (Taylor et al. 2025). Most of them are at the massive end of the main sequence of star-forming galaxies, but several are offset to the starburst regime (SFR/M⋆ ≈ 4× than the main sequence; Frias Castillo et al. 2023). None of the galaxies is strongly gravitationally lensed, as confirmed by ALMA 0.3″ resolution continuum imaging (Stach et al. 2018; Simpson et al. 2020). We can thus directly measure their intrinsic sizes.
2.2. JVLA observations
The AS2VLA survey used JVLA to observe the CO(1–0) emission (rest-frame frequency of νrest = 115.2712 GHz) in 30 DSFGs at z = 2.2 − 4.5. The survey comprised the JVLA programmes with the IDs 21A-254 (PI: Hodge) and 17A-251 (PI: Walter). The observations were taken between March 2021 and December 2023 under good weather conditions in the D-array configuration. The total time per source including overheads was four hours for almost all sources. The exceptions were AS2COS14.1, which was observed for eight hours, and AS2COS44.1 and AS2COS65.1, which were observed for two hours each.
We observed in the K and Ka bands using a contiguous bandwidth of 2 GHz with 2 MHz spectral channels. Depending on the source redshift, the angular resolution ranged from 2.5″ to 5.1″ (circularised FWHM); the maximum recoverable scale was 44″–60″. We manually inspected and calibrated the data using the Common Astronomy Software Applications package (CASA, McMullin et al. 2007) versions 6.4.1 and 6.4.3 and the standard JVLA pipeline.
The observations of the first 17 galaxies (11 robust detections) were presented by Frias Castillo et al. (2023, Paper I). The remaining sources from the completed survey will be presented in a forthcoming paper (Paper III); out of these, an additional eight sources were found to have secure detections of the CO(1-0) emission line. For this work (Paper II), we selected all the sources of the entire sample with secure CO(1-0) detections (peak S/N ≥ 3 in naturally weighted cleaned maps of CO(1-0) emission) – 19 sources in total.
2.3. Visibility-plane analysis and stacking
We directly measured the source sizes in the visibility plane. This approach bypasses several issues with the CLEANed images, including a varying beam shape, the fact that cleaned images combine the dirty and clean (Gaussian) beam, and the correlated noise in the image plane. For illustration, we show the stacked moment-0 image in Fig. 1. We achieved an rms sensitivity of σ = 0.014 Jy km s−1 beam−1 with a median beam FWHM 4.2″ × 2.7″, corresponding to ΣCO(1 − 0) ≃ 1.1 × 10⁷ K km s−1 pc2 kpc−2 at z = 3.1, which is the median redshift of our sample. An image-plane deconvolution with the imfit task in CASA did not yield a reliable source size.
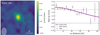 |
Fig. 1. Left: Stacked CO(1–0) image-plane for 19 sources with robust CO(1–0) detections. For the image-plane stack, the contours are drawn at ±(2, 4, 6…)σ, where 1σ = 0.014 Jy km s−1), and the white ellipses indicate the mean FWHM beam size (4.24″ × 2.73″, PA = 1.7 deg). Right: Visibility-plane stack. The uv-plane data are integrated over ±1 FWHM velocity range and radially binned with a step of 5 kλ. For CO(1–0), the exponential model with R1/2 = 0.49 ± 0.07″ (3.8 ± 0.5 kpc at our median redshift z = 3.1) is strongly preferred by the available data. |
For the visibility-plane analysis, we processed the data as follows: (1) When the wide-band imaging showed a significant (S/N ≥ 5) continuum, we subtracted the continuum (constant signal) from the data using the uvcontsub task. (2) We selected the velocity range within ±1 FWHM from the systemic velocity (using line widths from the mid-J CO lines, which are detected at a higher S/N). (3) We frequency-averaged the selected data into a single channel. (4) We binned the resulting visibilities in radial bins with a size of 2.5, 5, and 10 kλ. The fields were centred at the ALMA dust continuum peak (accurate to 0.1″). The phase-tracking centre was generally well aligned with the CO(1–0) emission. We phase-shifted three sources with noticeable offsets (AEG2, CDFN1, and CDFN2). For two sources (AS2COS14.1 and AS2COS31.1), we found a bright continuum source within the VLA primary beam. We subtracted these companions from the visibilities in CASA using the ft task.
We fitted each binned visibility function with (1) a point source (constant signal) and (2) an exponential profile. We preferred the exponential profile to the more widely used Gaussian profile because it provides a more physical description of the gas surface brightness distribution in star-forming galaxies3 (e.g. Leroy et al. 2009; Wang & Lilly 2022) and a dust and stellar light distribution (e.g. Hodge et al. 2016; Gullberg et al. 2019; Gillman et al. 2024. We used a Monte Carlo Markov chain modelling in the emcee package (Foreman-Mackey et al. 2013). We assumed wide uniform priors in the total flux and half-light radius. For each galaxy, we calculated the Akaike and Bayesian information criteria (AIC and BIC) for each model.
Table 1 lists the source sizes we inferred from the MCMC modelling. For galaxies for which the extended source is not preferred by the AIC and BIC, we list the upper limit on the source size based on the 95th percentile from the posterior of the exponential model.
Spectroscopic redshifts and CO(1–0) and [C I](1–0) half-light radii for individual galaxies.
3. Analysis and results
Fits to individual galaxies showed that the point-source model (our null hypothesis) is preferred for 15 out of 19 sources. For 4 sources, exponential profiles with R1/2 = 0.4 − 1.0″ are preferred (see Table 1). These sources are AS2COS13.1, AS2COS14.1, AS2COS28.14, and AS2UDS126.0. These 4 sources do not stand out from the rest of the sample in redshift, SFR, or Mmol. We hypothesise that our detections of extended emission in these source arise because their redshifts are lower than average compared to those of the whole sample (increasing the line signal), which also place the CO(1–0) line at frequencies at which the noise of the JVLA is particularly low. In particular, AS2COS13.1 and AS2COS14.1 have the highest S/N of the entire sample.
We stacked the 19 galaxies with CO(1–0) detections and fitted them with (1) a point-source, (2) an exponential profile, and (3) a combination of an exponential profile plus a point source (to capture the potential combination of a compact and an extended component). The exponential model is preferred by both AIC (ΔAIC = 27) and BIC (ΔBIC = 27) over the point-source model. The combination of an exponential and a point-source model is not preferred over a single exponential profile.
A change in the bandwidth we used for the calculation from two FWHMs to one FWHM resulted in a change ≤10% in the inferred R1/2. Similarly, when we removed baselines longer than 65 kλ (which might have a less reliable calibration), the change was ≤10% . Our results are thus robust with respect to the inclusion of the longest baselines. As our fiducial value, we adopted R1/2 = 0.49 ± 0.07″ (3.8 ± 0.5 kpc at z = 3.1), derived for a 2 × FWHM bandwidth using all baselines (Fig. 1, right).
The question then was whether the inferred mean source size was driven by the four extended sources. As a consistency check, we performed the stacking procedure without the four individually extended sources. The preferred model was a single exponential profile with R1/2 = 0.50 ± 0.10″, which is almost identical to our fiducial model.
Finally, we stress that the extent of our sources does not arise from the uncertainties in position and VLA pointing accuracy. The source positions were determined by sub-arsecond (≈0.3″) ALMA imaging; the VLA positional accuracy is typically 10% of the beam FWHM, that is, ≤0.35″ for an average observation from our sample. Our tests show that even an extreme 0.5″ pointing error yields a stacked source size of ≈0.09″, which is much smaller than the size inferred from our data.
3.1. Spectral stacking. No signatures for CO(1–0) inflows or outflows
We wished to determine whether the extended CO reservoirs were associated with molecular outflows or inflows. Gas outflows are indicated by high-velocity wings of the line profile and have been invoked to explain extended [C II] reservoirs around high-redshift galaxies from the ALPINE sample (Ginolfi et al. 2020; Pizzati et al. 2020, 2023). Although the SFRs of ALPINE galaxies are lower by an order of magnitude than our sample (10–100 M⊙ yr−1), the same mechanism might be at play at even more highly star-forming DSFGs.
To search for potential high-velocity components, we stacked the spectra of all 19 CO(1–0) detected galaxies. We adopted CLEANed cubes, which are made with natural weighting. As the half-light radius of the stacked emission is smaller than the VLA beam, we extracted spectra from an aperture equal to the beam size. The stacked spectrum was well fit by a single-Gaussian profile with a line FWHM of 590 ± 70 km s−1 (Fig. 2). Although our data were continuum subtracted, we found a low positive excess (≈5 μJy) at higher frequencies. This residual continuum emission is likely due to the curvature of the spectrum. At the rest-frame frequency of 115 GHz, the combination of free-free and dust thermal emission can lead to a significant spectral curvature. The lack of obvious outflow features indicates that the bulk of CO(1–0) is close to the systemic velocity.
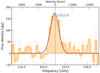 |
Fig. 2. Rest-frame stacked spectrum, extracted from Cleaned cubes and normalised to the median flux-weighted redshift z = 3.1. The rest-frame frequency resolution is 50 MHz (≈125 km s−1). The stacked spectrum is consistent with a Gaussian profile with a FWHM of 590 ± 70 km s−1; we found no evidence for outflow signatures. The slight positive/negative excess at higher/lower frequencies is likely a weak residual continuum signal and is not associated with the CO(1–0) line. |
3.2. ALMA [CI](1–0) data
We supplemented our CO(1–0) data with [C I](1–0) ALMA observations of ten galaxies from our parent sample detected in [C I](1–0) line by Chen et al. (2022, AS2COS31.1) and Frias Castillo et al. (2025, nine galaxies5). The [C I](1–0) line is considered an alternative tracer of molecular gas, including the CO-dark phase (e.g. at low metallicities). The baselines in the Frias Castillo et al. (2025) ALMA observations extended to 140 kλ, giving a slightly higher angular resolution (2.2″–4.0″ circularised beam FWHM) than our JVLA data.
Fitting the [C I] visibilities of individual sources, we found that five sources are consistent with an exponential profile, with half-light radii between 3 ± 1 and 9 ± 3 kpc (see Table 1). The sizes of the two sources that are extended in both CO(1–0) and [C I](1–0) (AS2COS14.1 and AS2UDS126.0) are consistent in both tracers.
Stacking all the data, we found that the exponential profile with R1/2 = 0.20 ± 0.11″ (1.6 ± 0.8 kpc) is preferred over the point-source profile, but at low significance (ΔAIC ≈ 2). The inferred mean [C I](1–0) size is 60 ± 25% smaller than that of CO(1–0) at a 2.3σ significance. Because the exponential profile is only very weakly preferred over the point-source profile, we conservatively placed an upper limit on the [C I](1–0) size by taking the 95th percentile of the posterior (≤0.33″, 2.6 kpc). The [CI](1-0) therefore appears to be marginally less extended than CO(1-0) (see Fig. 3).
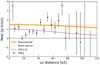 |
Fig. 3. Visibility-plane stack of the [C I](1–0) data for ten sources from Chen et al. (2022), Frias Castillo et al. (2025). The uv-plane data were integrated over ±1 FWHM velocity range, radially binned with a step of 5 kλ. The exponential model with R1/2 = 0.28 ± 0.10″ (2.2 ± 0.8 kpc, solid orange line) is marginally preferred by the evidence over the point-source one (dashed). We also show the best-fitting CO(1–0) profile (magenta) for comparison. |
3.3. PDR modelling
We inferred the thermodynamics of the molecular gas reservoirs by modelling the photo-dissociation region (PDR). Specifically, we estimated the gas density and far-UV irradiation using the PDRToolbox suite of uniform-density PDR models (Kaufman et al. 2006; Pound & Wolfire 2008). As we show in Section 4, the CO(1–0)/[C I](1–0) sizes inferred from the uv-plane stack are consistent with the extended component of the [C II] and far-IR continuum emission seen in previous studies of DSFGs.
For the far-IR continuum, we assumed that the extended component accounted for 13% of the total luminosity (Gullberg et al. 2019, see below). As our sample currently lacks ancillary observations in the [C II] 158-μm line, for example, we adopted the surface brightness range reported for resolved observations of z = 2 − 4 DSFGs (Gullberg et al. 2018; Rybak et al. 2019; Mitsuhashi et al. 2021): [C II]/FIR = (1.5 − 38)×10−3. We assumed that 20% of the [C II] emission arises from ionised gas (as seen in nearby star-forming galaxies; Croxall et al. 2017; Sutter et al. 2019) and applied geometric corrections to the (optically thin) predicted [C II] and far-IR continuum by multiplying them by a factor of two. Finally, we included the [C I](1–0) line under the assumption that it is co-spatial with CO(1–0).
Figure 4 shows the resulting PDR models compared to the models for individual galaxies from the AS2VLA sample from Frias Castillo et al. (2025). For the stacked data, we find a median n = 104.4 ± 0.4 cm−3, G = 103.4 ± 0.4G0 (1 G0 = 1.6 × 10⁻³ erg s−1 cm−2). These values are much higher than expected from a supposedly cold diffuse gas and comparable to values found in Galactic star-forming clouds (e.g. Oberst et al. 2011). The immediate interpretation is that the extended CO(1–0) (and [C II]) emission arise from in situ star formation. This interpretation is consistent with results from resolved imaging of Hα emission (which traces ionised gas) around z ≈ 2 DSFGs, which revealed extended star formation with a half-light radius of ≈4 kpc (e.g. Chen et al. 2020; Birkin et al. 2024).
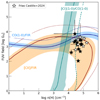 |
Fig. 4. PDR model for the extended CO(1–0) reservoirs compared to source-averaged models for DSFGs from the AS2VLA sample from Frias Castillo et al. (2025, stars). The sources from Frias Castillo et al. (2025) that are part of our sample are indicated by solid symbols, and those that are not are shown with open symbols. In addition to our CO(1–0) stacked data, we used [C II] and far-IR continuum from the literature (see main text for details). The dotted blue line corresponds to CO(1–0) being suppressed by 50% due to elevated CMB background. The dashed red line corresponds to 20% [C II] arising from the PDRs (as opposed to the fiducial value of 80%). The line and continuum ratios are consistent with an elevated density (n = 104.4 ± 0.4 cm−3) and a high far-UV illumination (G = 103.4 ± 0.4G0), indicating they originate in dense, star-forming regions, rather than in a diffuse, quiescent gas. |
To assess how our conclusions depend on the various assumptions made in the PDR modelling, we conducted the following tests.
-
What if CO(1–0) is strongly suppressed by CMB? In this test, we assumed a 50% suppression (an extreme scenario at z ≈ 3; e.g. da Cunha et al. 2013). We found that the inferred far-UV illumination increased by ≈0.5 dex (dotted blue line in Fig. 4).
-
What if the bulk of [C II] arises from ionised gas and not from the PDRs? In this test, we lowered the PDR contribution to the [C II] flux to 20%, which caused the inferred far-UV illumination to increase by almost 1 dex (dotted red line in Fig. 4).
-
What if [C I](1–0) is more compact than CO(1–0) (i.e., the ratio of atomic/molecular carbon increases at large radii)? In this test, we assumed the [C I](1–0) scale length indicated by the tentative results in Section 3.2 and accordingly re-calculated the [C I](1–0) surface brightness at the CO(1–0) half-light radius. The inferred density increased to ≈104.5 cm−3 , i.e., by ≈0.1 dex (dotted green line in Fig. 4).
We derived the filling factor ϕ, that is, the number of emitting regions per line of sight, by comparing the observed CO(1–0) surface brightness with the PDRTOOLBOX models. Specifically, for each realisation of G, n, we calculated the corresponding filling factor at the CO(1–0) half-light radius R1/2 as
 (1)
(1)
where ΣCO(1 − 0) is the CO(1–0) flux per solid angle predicted by PDRTOOLBOX, and DL is the luminosity distance. Marginalising over G and nH then yielded ϕ(R = R1/2) = 0.8 ± 0.5%. We discuss the context of this result in Section 4.4.
4. Discussion
In this section, we compare the results of our stacking procedure and the PDR modelling to other studies of high-redshift DSFGs (Sect. 4.1), dust and stellar emission (Sect. 4.2), and hydrodynamical simulations (Sect. 4.3). Finally, we address the nature of extended CO(1–0) reservoirs (Sect. 4.4).
4.1. Sizes of extended molecular gas reservoirs in high-redshift DSFGs
Figure 5 places our measurement of CO(1–0) sizes in the context of other high-redshift observations. Specifically, we show the literature CO(1–0) (Ivison et al. 2011; Thomson et al. 2012; Dannerbauer et al. 2017; Frias Castillo et al. 2022; Stanley et al. 2023) and [C II] measurements (Gullberg et al. 2018; Rybak et al. 2019; Mitsuhashi et al. 2021). We derived Mmol = αCO × L′CO(1 − 0) with αCO = 1.0 (e.g. Calistro Rivera et al. 2018). For the [C II] based masses, we used Mmol = α[CII] × L[CII], assuming α[CII] = 30 M⊙/L⊙ (Zanella et al. 2018).
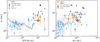 |
Fig. 5. Half-light radii of CO(1–0) and [C II] emission vs. star formation rate (left) and total molecular gas mass (right) for galaxies from our sample and from the literature (see Section 4.1 for references). The protoclusters from Emonts et al. (2016) and Dannerbauer et al. (2017) are highlighted by circles, and open symbols indicate lensed sources from Stanley et al. (2023). We also show predictions for z = 3.1 galaxies from the SIMBA simulation (Davé et al. 2019) as open grey symbols, and the grey lines indicate the running average. The inferred size of the CO(1–0) emission in our sample is consistent with the extended CO(1–0) and [C II] reservoirs around other high-redshift DSFGs with a comparable SFR. |
Our inferred CO(1–0) size is comparable to the CO(1–0) sizes reported in the literature for other highly star-forming galaxy populations and the [C II] reservoirs seen around high-redshift DSFGs. Our inferred sizes are also consistent with the CO(1–0) sizes reported by Stanley et al. (2023) for the (potentially) non-lensed sources from the Z-GAL sample (median R1/2 = 4.4 kpc). In contrast, our CO(1–0) size is larger than the typical extent of CO(3–2) emission in z = 2 − 3 DSFGs – R1/2 ≤ 2.6 kpc that was recently reported by Amvrosiadis et al. (2025). The true extent of the molecular gas reservoirs in DSFGs might be even larger than those inferred from our CO(1–0) stacking. First, molecular gas becomes metal-poor with increasing distance from the centre of the galaxy (e.g. Schimek et al. 2024), causing αCO to increase towards the outskirts. Moreover, the elevated CMB temperature at high redshift can significantly suppress the CO(1–0) emission, particularly at low gas kinetic temperatures and densities (by up to 50%; e.g. da Cunha et al. 2013; Zhang et al. 2016). The CMB effect is more limited when the molecular gas is mostly in the form of higher-density ISM in star-forming regions or satellite galaxies, however.
The CO(1–0) extent derived from our stacking is comparable to the sizes of [C II] emission in high-redshift galaxies with a similar SFR and molecular gas mass (Fig. 5, e.g., Gullberg et al. 2018; Rybak et al. 2019; Mitsuhashi et al. 2021), and with those reported around z = 4 − 6 star-forming galaxies from the CRISTAL sample (R1/2 = 3.2 ± 1.3 kpc, Ikeda et al. 2025).
The extended [C II] reservoirs around high-redshift galaxies have been hypothesised to primarily arise from atomic or ionised gas (e.g. Ikeda et al. 2025), perhaps deposited by outflows (e.g., Pizzati et al. 2020, 2023. The comparable extent of the CO(1–0) (which is only associated with molecular gas) indicates that molecular gas might be the dominant component of the extended gas haloes.
4.2. Molecular gas versus dust and stellar emission
We compared the size of the extended CO(1–0) emission to the far-infrared and near-infrared continuum in DSFGs in more physical terms by comparing the molecular gas sizes to star formation (traced by far-IR continuum) and stellar emission (traced by JWST NIRCam imaging). Table 2 lists the sizes of the different tracers.
Comparison of CO(1–0) and [C I(1–0)] sizes with [C II], ALMA 870 μm continuum, and JWST 4.4 μm continuum.
Using high-resolution 870-μm ALMA imaging of the SCUBA-2 sources in the UKIDSS/UDS field (from which our sample is partially drawn), Gullberg et al. (2019) found a half-light radius of 1.1 ± 0.3 kpc, assuming an exponential profile6. Somewhat larger sizes (1.8 ± 0.1 kpc) were inferred for the ALESS sample of DSFGs (Hodge et al. 2016, 2025), which span a comparable redshift range (median  ) and 850 μm flux (
 mJy) to our galaxies. In either case, the 870 μm continuum is more compact by a factor of ≈2 − 3 than the CO(1–0) reservoir.
In total, 50–80% of the CO(1–0) emission arises outside the region that contains 90% of the dust continuum emission (adopting the Gullberg et al. 2019 and Hodge et al. 2016 sizes, respectively). The remarkable difference in sizes between the dust continuum and CO(1–0) emission indicates that only a small fraction of the total molecular gas in high-redshift DSFGs contributes directly to their high SFRs. This interpretation is supported by recent studies of HCN/HCO+/HNC emission in z ≥ 2 DSGFs, which found very low dense-gas fractions (Rybak et al. 2022).
The presence of an extended molecular gas agrees well with the extended low-surface brightness dust continuum reported by Gullberg et al. (2019), who reported after stacking ALMA imaging of 153 DSFGs that ≈13% of the 870 μm continuum arises from an extended component with an assumed radius of ≈4 kpc, which is similar to our measured CO(1–0) size. This extended continuum emission further supports that high-redshift DSFGs lie in significant metal-enriched gas and reservoirs.
As the bulk of the molecular gas is far outside the central star-forming region, we determined whether the high SFRs of DSFGs might be sustained by smooth gas accretion from these reservoirs. We estimated the required inward-streaming velocity by dividing the half-light radius by one half of the median gas depletion time (tdep = 140 ± 70 Myr, Frias Castillo et al. 2023). We obtained vin = 50 ± 12 km s−1, which is consistent with the line-of-sight velocity dispersions seen in high-resolution kinematic studies of z = 2 − 4 DSFGs (10–100 km s−1; e.g. Hodge et al. 2012; Rybak et al. 2015; Swinbank et al. 2015; Rizzo et al. 2021, 2023; Birkin et al. 2024; Amvrosiadis et al. 2025. The central star formation can thus be supported by smooth streaming of gas within the galaxy without major mergers (see, e.g. Narayanan et al. 2015).
For the sizes of stellar emission, we adopted the 4.4-μm half-light radius of R1/2 = 2.7 ± 0.2 kpc derived by Gillman et al. (2024) for the AS2COSMOS and AS2UDS DSFGs. A similar value (3.0 ± 0.3 kpc) was found for the ALESS sample by Hodge et al. (2025). The CO(1–0) emission in our sample is a factor of 1.4 ± 0.2 and 1.3 ± 0.2 more extended than the 4.4 μm sizes from Gillman et al. (2024) and Hodge et al. (2025), respectively. This size discrepancy indicates that the cold molecular gas in DFGs appears to extend beyond the stellar emission of the galaxy.
The discrepancy in the spatial extent of molecular gas versus star formation and stars might be even more pronounced than indicated from the CO(1–0) and 4.4 μm imaging. First, molecular gas might be more extended than CO(1–0) emission because of the higher αCO and increased CMB attenuation in the low-density outskirts of galaxies. Second, if the dust temperature decreases towards larger radii (e.g. Calistro Rivera et al. 2018), star formation will be more centrally concentrated than the observed-frame 870 μm continuum. Finally, the stellar component is likely more compact than the near-infrared continuum; high obscuration in the central region will inflate the apparent near-infrared sizes compared to the actual stellar component (Sorba & Sawicki 2018; Popping et al. 2022; Smail et al. 2023; Gillman et al. 2024).
We compared the relative sizes of molecular gas, stars, and dust continuum in high-redshift DSFGs compare to other galaxy populations. At z ∼ 0, spiral galaxies have molecular gas reservoirs with half-light radii of ≈1–5 kpc (e.g. Regan et al. 2001; Leroy et al. 2009). The CO(1–0)/(2–1) emission in spiral galaxies is typically smaller than the stellar emission (e.g. Regan et al. 2001 reported a mean ratio of 0.88 ± 0.14). In contrast, the z ≈ 0 ultraluminous infrared galaxies (ULIRGs) have very compact molecular gas reservoirs (typically smaller than ≤1 kpc; e.g. Bellocchi et al. 2022), which is smaller by a factor of a few than their stellar components. The larger extent of molecular gas compared to the stellar component in DSFGs suggests an inside-out growth (as implied by the small dust continuum sizes) or the presence of satellite galaxies.
4.3. Comparison to molecular gas in hydrodynamical simulations
We compared our findings to predictions from simulations. Diffuse molecular gas has been notoriously difficult to produce in large-volume hydrodynamical simulations because convergence requires very high (parsec-scale) resolution (e.g. Faucher-Giguère & Oh 2023).
For the comparison in Fig. 5, we took data from the SIMBA cosmological simulation (Davé et al. 2019). SIMBA successfully reproduces key parameters of high-redshift DSFGs (Lovell et al. 2021). We focused on the z = 3.1 snapshot from the default 100 cMpc box. We selected galaxies with Mmol ≥ 1 × 10¹¹ M⊙, which is comparable in mass to our sample. Specifically, we considered the molecular gas masses and the (total) gas half-light radii from the SIMBA catalogue. We note that SIMBA does not predict H2 directly. The molecular gas is instead predicted by post-processing the simulation data (Davé et al. 2019). The gas sizes are determined by averaging two-dimensional projections along the three axes.
Fig. 5 shows that the sizes and mean surface densities of SIMBA galaxies with the highest molecular gas masses are comparable to those in our sample. Unlike the observed galaxies, however, SIMBA galaxies tend to become more compact with increasing SFR. This discrepancy is likely a result of the sub-grid star formation prescription used in SIMBA, which implements a Kennicutt-Schmidt law (i.e. the star formation rate scales with the gas surface density; Davé et al. 2019).
4.4. The nature of the extended CO(1–0) reservoirs
We studied the nature of the extended CO(1–0) emission around DSFGs. They might be smooth extensions of the galaxy gas reservoirs, tidal features induced by galaxy mergers, or individual faint satellites. The distinction between different scenarios requires deep sub-arcsecond observations of individual galaxies with a high sensitivity to large spatial scales. Unfortunately, our stacking averages the data in the azimuthal direction, which means smearing emission from compact satellites.
Despite the lack of angular resolution, significant insights can be obtained from the PDR modelling. As shown in Section 3.3, the inferred gas density and far-UV illumination are comparable to those in Galactic star-forming clouds. Conversely, the filling factor (ϕ = 0.8 ± 0.5%) is smaller than the disks of nearby galaxies, in which it ranges from a few percent to a factor of unity (e.g. Wolfire et al. 1990; Walsh et al. 2002; Luhman et al. 2003).
The combination of high G, n, and low ϕ indicates that molecular gas resides in compact dense clouds that are distributed sparsely on the outskirts of galaxies. Alternatively, the clouds might be concentrated in satellites with a small angular separation from the host (although we note the lack of companions at a separation of ≤1″ in JWST NIRCam imaging of DSFGs in Gillman et al. 2024; Hodge et al. 2025). In either scenario, the molecular gas in the galaxy outskirts would be significantly clumpy and not distributed in a smooth diffuse halo.
5. Conclusions
We have presented results of stacking CO(1–0) observations of a sample of 19 high-redshift DSFGs. Comprising 84 hours in the most compact JVLA array configuration, this is the deepest study of extended cold-gas reservoirs around early galaxies to date. Our main findings are listed below.
-
The stacked uv-plane data of the CO(1–0) emission show an extended exponential profile with a half-light radius of 3.8 ± 0.5 kpc. The inferred size is comparable to extended CO(1–0) and [C II] reservoirs that were previously reported around high-redshift DSFGs.
-
Four galaxies have clearly extended CO(1–0) emission with half-light radii between 3.4–7.2 kpc.
-
Applying the same procedure to ALMA [C I](1–0) observations, we found that [C I](1–0) appears to be more compact (R1/2 ≤ 2.6 kpc) than CO(1–0), although the two sizes are consistent within 2σ. Five galaxies show extended [C I](1–0) emission with half-light radii of 3.1–7.7 kpc.
-
Using PDR modelling to infer physical conditions in the extended CO(1–0) reservoirs, we found a density of ≈104.5 cm−3 , a far-UV field of ≈103.5G0, and a filling factor of ≈1%. These results indicate that the extended CO (and [C I] and [C II]) emission arises from sparsely distributed star-forming clouds.
-
The inferred sizes of CO(1–0) cold-gas reservoir are significantly larger than the bulk of the 870 μm dust continuum, but they are similar to the fainter extended dust component that was reported in these sources. The CO(1–0) is somewhat larger than the 4.4-μm stellar emission. The bulk of the molecular gas (50–80%) resides outside the FIR-bright star-forming region and does not directly contribute to the observed star formation.
Our findings reveal that the bulk of molecular gas in high-redshift DSFGs resides in extended reservoirs on a scale of 10 kpc. Only a small fraction of this gas contributes directly to the observed star formation.
Also known as sub-millimetre galaxies (SMGs).
AS2VLA = ALMA, SCUBA-2, VLA.
For the literature source sizes derived using Gaussian profiles, we converted the half-light radius from the Gaussian into an exponential profile.
AS2COS28.1 has a companion offset by ≈20 kpc, which might contribute to the large apparent source size (Chen et al. 2022).
The tenth galaxy detected in Frias Castillo et al. (2025) – AS2COS66.1 – has only part of the [C I](1–0) line covered by the ALMA tuning; consequently, we do not include it in our analysis.
After applying a correction to account for a faint extended component (Smail et al. 2021).
Acknowledgments
M.R. is supported by the NWO Veni project “Under the lens” (VI.Veni.202.225). J.A.H. acknowledges support from the ERC Consolidator Grant 101088676 (VOYAJ). I.R.S. and A.M.S. acknowledge STFC grant ST/X001075/1. HD acknowledges support from the Agencia Estatal de Investigación del Ministerio de Ciencia, Innovación y Universidades (MCIU/AEI) under grant (Construcción de cúmulos de galaxias en formación a través de la formación estelar oscurecida por el polvo) and the European Regional Development Fund (ERDF) with reference (PID2022-143243NB-I00/10.13039/501100011033). E.F.-J.A. acknowledges support from UNAM-PAPIIT project IA102023 and IA104725, and from CONAHCyT Ciencia de Frontera project ID: CF-2023-I-506. C.-C.C. acknowledges support from the National Science and Technology Council of Taiwan (111-2112M-001-045-MY3), as well as Academia Sinica through the Career Development Award (AS-CDA-112-M02). The National Radio Astronomy Observatory is a facility of the National Science Foundation operated under cooperative agreement by Associated Universities, Inc. This paper makes use of the following ALMA data: ADS/JAO.ALMA #2021.1.01324.S. ALMA is a partnership of ESO (representing its member states), NSF (USA) and NINS (Japan), together with NRC (Canada), MOST and ASIAA (Taiwan), and KASI (Republic of Korea), in cooperation with the Republic of Chile. The Joint ALMA Observatory is operated by ESO, AUI/NRAO and NAOJ. The authors are thankful for the assistance from Allegro, the European ALMA Regional Center node in the Netherlands. We thank D. Narayanan, E. Pizzati and A. Schimek for sharing insights from theoretical models and simulations. Finally, we thank the referee – P. Cox – for his detailed comments that helped us improve this manuscript.
References
- Amvrosiadis, A., Wardlow, J. L., Birkin, J. E., et al. 2025, MNRAS, 536, 3757 [Google Scholar]
- Battisti, A. J., da Cunha, E., Grasha, K., et al. 2019, ApJ, 882, 61 [NASA ADS] [CrossRef] [Google Scholar]
- Bellocchi, E., Pereira-Santaella, M., Colina, L., et al. 2022, A&A, 664, A60 [NASA ADS] [CrossRef] [EDP Sciences] [Google Scholar]
- Birkin, J. E., Weiss, A., Wardlow, J. L., et al. 2021, MNRAS, 501, 3926 [Google Scholar]
- Birkin, J. E., Puglisi, A., Swinbank, A. M., et al. 2024, MNRAS, 531, 61 [NASA ADS] [CrossRef] [Google Scholar]
- Calistro Rivera, G., Hodge, J. A., Smail, I., et al. 2018, ApJ, 863, 56 [Google Scholar]
- Chen, C.-C., Harrison, C. M., Smail, I., et al. 2020, A&A, 635, A119 [NASA ADS] [CrossRef] [EDP Sciences] [Google Scholar]
- Chen, C.-C., Liao, C.-L., Smail, I., et al. 2022, ApJ, 929, 159 [NASA ADS] [CrossRef] [Google Scholar]
- Cicone, C., Mainieri, V., Circosta, C., et al. 2021, A&A, 654, L8 [NASA ADS] [CrossRef] [EDP Sciences] [Google Scholar]
- Cox, P., Neri, R., Berta, S., et al. 2023, A&A, 678, A26 [Google Scholar]
- Croxall, K. V., Smith, J. D., Pellegrini, E., et al. 2017, ApJ, 845, 96 [Google Scholar]
- da Cunha, E., Groves, B., Walter, F., et al. 2013, ApJ, 766, 13 [Google Scholar]
- da Cunha, E., Walter, F., Smail, I. R., et al. 2015, ApJ, 806, 110 [Google Scholar]
- Dannerbauer, H., Lehnert, M. D., Emonts, B., et al. 2017, A&A, 608, A48 [NASA ADS] [CrossRef] [EDP Sciences] [Google Scholar]
- Davé, R., Anglés-Alcázar, D., Narayanan, D., et al. 2019, MNRAS, 486, 2827 [Google Scholar]
- Dudzevičiūtė, U., Smail, I., Swinbank, A. M., et al. 2020, MNRAS, 494, 3828 [Google Scholar]
- Emonts, B. H. C., Lehnert, M. D., Villar-Martín, M., et al. 2016, Science, 354, 1128 [NASA ADS] [CrossRef] [Google Scholar]
- Faucher-Giguère, C.-A., & Oh, S. P. 2023, ARA&A, 61, 131 [CrossRef] [Google Scholar]
- Foreman-Mackey, D., Hogg, D. W., Lang, D., & Goodman, J. 2013, PASP, 125, 306 [Google Scholar]
- Frayer, D. T., Harris, A. I., Baker, A. J., et al. 2011, ApJ, 726, L22 [NASA ADS] [CrossRef] [Google Scholar]
- Frayer, D. T., Maddalena, R. J., Ivison, R. J., et al. 2018, ApJ, 860, 87 [NASA ADS] [CrossRef] [Google Scholar]
- Frias Castillo, M., Rybak, M., Hodge, J., et al. 2022, ApJ, 930, 35 [NASA ADS] [CrossRef] [Google Scholar]
- Frias Castillo, M., Hodge, J., Rybak, M., et al. 2023, ApJ, 945, 128 [NASA ADS] [CrossRef] [Google Scholar]
- Frias Castillo, M., Rybak, M., Hodge, J. A., et al. 2025, ApJ, 987, 158 [Google Scholar]
- Fujimoto, S., Ouchi, M., Ferrara, A., et al. 2019, ApJ, 887, 107 [Google Scholar]
- Fujimoto, S., Silverman, J. D., Bethermin, M., et al. 2020, ApJ, 900, 1 [Google Scholar]
- Geach, J. E., Dunlop, J. S., Halpern, M., et al. 2017, MNRAS, 465, 1789 [Google Scholar]
- Gillman, S., Smail, I., Gullberg, B., et al. 2024, A&A, 691, A299 [NASA ADS] [CrossRef] [EDP Sciences] [Google Scholar]
- Ginolfi, M., Maiolino, R., Nagao, T., et al. 2017, MNRAS, 468, 3468 [CrossRef] [Google Scholar]
- Ginolfi, M., Jones, G. C., Béthermin, M., et al. 2020, A&A, 633, A90 [NASA ADS] [CrossRef] [EDP Sciences] [Google Scholar]
- Gullberg, B., Swinbank, A. M., Smail, I., et al. 2018, ApJ, 859, 12 [Google Scholar]
- Gullberg, B., Smail, I., Swinbank, A. M., et al. 2019, MNRAS, 490, 4956 [Google Scholar]
- Hainline, L. J., Blain, A. W., Greve, T. R., et al. 2006, ApJ, 650, 614 [Google Scholar]
- Harrington, K. C., Weiss, A., Yun, M. S., et al. 2021, ApJ, 908, 95 [NASA ADS] [CrossRef] [Google Scholar]
- Harris, A. I., Baker, A. J., Frayer, D. T., et al. 2012, ApJ, 752, 152 [NASA ADS] [CrossRef] [Google Scholar]
- Hill, R., Chapman, S. C., Scott, D., et al. 2018, MNRAS, 477, 2042 [Google Scholar]
- Hodge, J. A., & da Cunha, E. 2020, R. Soc. Open Sci., 7, 200556 [NASA ADS] [CrossRef] [Google Scholar]
- Hodge, J. A., Carilli, C. L., Walter, F., et al. 2012, ApJ, 760, 11 [Google Scholar]
- Hodge, J. A., Swinbank, A. M., Simpson, J. M., et al. 2016, ApJ, 833, 103 [Google Scholar]
- Hodge, J. A., da Cunha, E., Kendrew, S., et al. 2025, ApJ, 978, 165 [NASA ADS] [CrossRef] [Google Scholar]
- Ikeda, R., Tadaki, K.-I., Mitsuhashi, I., et al. 2025, A&A, 693, A237 [NASA ADS] [CrossRef] [EDP Sciences] [Google Scholar]
- Ivison, R. J., Smail, I., Papadopoulos, P. P., et al. 2010, MNRAS, 404, 198 [NASA ADS] [Google Scholar]
- Ivison, R. J., Papadopoulos, P. P., Smail, I., et al. 2011, MNRAS, 412, 1913 [Google Scholar]
- Jin, S., Dannerbauer, H., Emonts, B., et al. 2021, A&A, 652, A11 [NASA ADS] [CrossRef] [EDP Sciences] [Google Scholar]
- Jones, G. C., Maiolino, R., Carniani, S., et al. 2023, MNRAS, 522, 275 [NASA ADS] [CrossRef] [Google Scholar]
- Kaufman, M. J., Wolfire, M. G., & Hollenbach, D. J. 2006, ApJ, 644, 283 [Google Scholar]
- Leroy, A. K., Walter, F., Bigiel, F., et al. 2009, AJ, 137, 4670 [Google Scholar]
- Liao, C.-L., Chen, C.-C., Wang, W.-H., et al. 2024, ApJ, 961, 226 [NASA ADS] [CrossRef] [Google Scholar]
- Lovell, C. C., Geach, J. E., Davé, R., Narayanan, D., & Li, Q. 2021, MNRAS, 502, 772 [NASA ADS] [CrossRef] [Google Scholar]
- Luhman, M. L., Satyapal, S., Fischer, J., et al. 2003, ApJ, 594, 758 [Google Scholar]
- Magnelli, B., Elbaz, D., Chary, R. R., et al. 2011, A&A, 528, A35 [NASA ADS] [CrossRef] [EDP Sciences] [Google Scholar]
- McMullin, J. P., Waters, B., Schiebel, D., Young, W., & Golap, K. 2007, in Astronomical Data Analysis Software and Systems XVI, eds. R. A. Shaw, F. Hill, & D. J. Bell, Astronomical Society of the Pacific Conference Series, 376, 127 [Google Scholar]
- Mitsuhashi, I., Matsuda, Y., Smail, I., et al. 2021, ApJ, 907, 122 [NASA ADS] [CrossRef] [Google Scholar]
- Narayanan, D., Turk, M., Feldmann, R., et al. 2015, Nature, 525, 496 [NASA ADS] [CrossRef] [Google Scholar]
- Oberst, T. E., Parshley, S. C., Nikola, T., et al. 2011, ApJ, 739, 100 [NASA ADS] [CrossRef] [Google Scholar]
- Pizzati, E., Ferrara, A., Pallottini, A., et al. 2020, MNRAS, 495, 160 [Google Scholar]
- Pizzati, E., Ferrara, A., Pallottini, A., et al. 2023, MNRAS, 519, 4608 [NASA ADS] [CrossRef] [Google Scholar]
- Planck Collaboration XIII. 2016, A&A, 594, A13 [NASA ADS] [CrossRef] [EDP Sciences] [Google Scholar]
- Popping, G., Pillepich, A., Calistro Rivera, G., et al. 2022, MNRAS, 510, 3321 [CrossRef] [Google Scholar]
- Pound, M. W., & Wolfire, M. G. 2008, in Astronomical Data Analysis Software and Systems XVII, eds. R. W. Argyle, P. S. Bunclark, & J. R. Lewis, Astronomical Society of the Pacific Conference Series, 394, 654 [Google Scholar]
- Regan, M. W., Thornley, M. D., Helfer, T. T., et al. 2001, ApJ, 561, 218 [CrossRef] [Google Scholar]
- Riechers, D. A., Hodge, J., Walter, F., Carilli, C. L., & Bertoldi, F. 2011a, ApJ, 739, L31 [Google Scholar]
- Riechers, D. A., Carilli, L. C., Walter, F., et al. 2011b, ApJ, 733, L11 [Google Scholar]
- Rizzo, F., Vegetti, S., Fraternali, F., Stacey, H. R., & Powell, D. 2021, MNRAS, 507, 3952 [NASA ADS] [CrossRef] [Google Scholar]
- Rizzo, F., Roman-Oliveira, F., Fraternali, F., et al. 2023, A&A, 679, A129 [NASA ADS] [CrossRef] [EDP Sciences] [Google Scholar]
- Rybak, M., Vegetti, S., McKean, J. P., Andreani, P., & White, S. D. M. 2015, MNRAS, 453, L26 [NASA ADS] [CrossRef] [Google Scholar]
- Rybak, M., Calistro Rivera, G., Hodge, J. A., et al. 2019, ApJ, 876, 112 [Google Scholar]
- Rybak, M., Hodge, J. A., Vegetti, S., et al. 2020, MNRAS, 494, 5542 [NASA ADS] [CrossRef] [Google Scholar]
- Rybak, M., Hodge, J. A., Greve, T. R., et al. 2022, A&A, 667, A70 [NASA ADS] [CrossRef] [EDP Sciences] [Google Scholar]
- Schimek, A., Decataldo, D., Shen, S., et al. 2024, A&A, 682, A98 [NASA ADS] [CrossRef] [EDP Sciences] [Google Scholar]
- Simpson, J. M., Smail, I., Swinbank, A. M., et al. 2019, ApJ, 880, 43 [NASA ADS] [CrossRef] [Google Scholar]
- Simpson, J. M., Smail, I., Dudzevičiūtė, U., et al. 2020, MNRAS, 495, 3409 [Google Scholar]
- Smail, I., Dudzevičiūtė, U., Stach, S. M., et al. 2021, MNRAS, 502, 3426 [NASA ADS] [CrossRef] [Google Scholar]
- Smail, I., Dudzevičiūtė, U., Gurwell, M., et al. 2023, ApJ, 958, 36 [NASA ADS] [CrossRef] [Google Scholar]
- Sorba, R., & Sawicki, M. 2018, MNRAS, 476, 1532 [NASA ADS] [CrossRef] [Google Scholar]
- Stach, S. M., Smail, I., Swinbank, A. M., et al. 2018, ApJ, 860, 161 [Google Scholar]
- Stanley, F., Jones, B. M., Riechers, D. A., et al. 2023, ApJ, 945, 24 [NASA ADS] [CrossRef] [Google Scholar]
- Sutter, J., Dale, D. A., Croxall, K. V., et al. 2019, ApJ, 886, 60 [NASA ADS] [CrossRef] [Google Scholar]
- Swinbank, A. M., Smail, I., Chapman, S. C., et al. 2010, MNRAS, 405, 234 [NASA ADS] [Google Scholar]
- Swinbank, A. M., Dye, S., Nightingale, J. W., et al. 2015, ApJ, 806, L17 [Google Scholar]
- Tacconi, L. J., Genzel, R., & Sternberg, A. 2020, ARA&A, 58, 157 [NASA ADS] [CrossRef] [Google Scholar]
- Taylor, D. J., Swinbank, A. M., Smail, I., et al. 2025, MNRAS, 536, 1149 [Google Scholar]
- Thomson, A. P., Ivison, R. J., Smail, I., et al. 2012, MNRAS, 425, 2203 [NASA ADS] [CrossRef] [Google Scholar]
- Tumlinson, J., Peeples, M. S., & Werk, J. K. 2017, ARA&A, 55, 389 [Google Scholar]
- Walsh, W., Beck, R., Thuma, G., et al. 2002, A&A, 388, 7 [NASA ADS] [CrossRef] [EDP Sciences] [Google Scholar]
- Walter, F., Carilli, C., Neeleman, M., et al. 2020, ApJ, 902, 111 [Google Scholar]
- Wang, E., & Lilly, S. J. 2022, ApJ, 927, 217 [NASA ADS] [CrossRef] [Google Scholar]
- Wolfire, M. G., Tielens, A. G. G. M., & Hollenbach, D. 1990, ApJ, 358, 116 [NASA ADS] [CrossRef] [Google Scholar]
- Zanella, A., Daddi, E., Magdis, G., et al. 2018, MNRAS, 481, 1976 [Google Scholar]
- Zavala, J. A., Casey, C. M., Manning, S. M., et al. 2021, ApJ, 909, 165 [CrossRef] [Google Scholar]
- Zhang, Z.-Y., Papadopoulos, P. P., Ivison, R. J., et al. 2016, R. Soc. Open Sci., 3, 160025 [Google Scholar]
All Tables
Spectroscopic redshifts and CO(1–0) and [C I](1–0) half-light radii for individual galaxies.
Comparison of CO(1–0) and [C I(1–0)] sizes with [C II], ALMA 870 μm continuum, and JWST 4.4 μm continuum.
All Figures
|
Fig. 1. Left: Stacked CO(1–0) image-plane for 19 sources with robust CO(1–0) detections. For the image-plane stack, the contours are drawn at ±(2, 4, 6…)σ, where 1σ = 0.014 Jy km s−1), and the white ellipses indicate the mean FWHM beam size (4.24″ × 2.73″, PA = 1.7 deg). Right: Visibility-plane stack. The uv-plane data are integrated over ±1 FWHM velocity range and radially binned with a step of 5 kλ. For CO(1–0), the exponential model with R1/2 = 0.49 ± 0.07″ (3.8 ± 0.5 kpc at our median redshift z = 3.1) is strongly preferred by the available data. |
| In the text | |
|
Fig. 2. Rest-frame stacked spectrum, extracted from Cleaned cubes and normalised to the median flux-weighted redshift z = 3.1. The rest-frame frequency resolution is 50 MHz (≈125 km s−1). The stacked spectrum is consistent with a Gaussian profile with a FWHM of 590 ± 70 km s−1; we found no evidence for outflow signatures. The slight positive/negative excess at higher/lower frequencies is likely a weak residual continuum signal and is not associated with the CO(1–0) line. |
| In the text | |
|
Fig. 3. Visibility-plane stack of the [C I](1–0) data for ten sources from Chen et al. (2022), Frias Castillo et al. (2025). The uv-plane data were integrated over ±1 FWHM velocity range, radially binned with a step of 5 kλ. The exponential model with R1/2 = 0.28 ± 0.10″ (2.2 ± 0.8 kpc, solid orange line) is marginally preferred by the evidence over the point-source one (dashed). We also show the best-fitting CO(1–0) profile (magenta) for comparison. |
| In the text | |
|
Fig. 4. PDR model for the extended CO(1–0) reservoirs compared to source-averaged models for DSFGs from the AS2VLA sample from Frias Castillo et al. (2025, stars). The sources from Frias Castillo et al. (2025) that are part of our sample are indicated by solid symbols, and those that are not are shown with open symbols. In addition to our CO(1–0) stacked data, we used [C II] and far-IR continuum from the literature (see main text for details). The dotted blue line corresponds to CO(1–0) being suppressed by 50% due to elevated CMB background. The dashed red line corresponds to 20% [C II] arising from the PDRs (as opposed to the fiducial value of 80%). The line and continuum ratios are consistent with an elevated density (n = 104.4 ± 0.4 cm−3) and a high far-UV illumination (G = 103.4 ± 0.4G0), indicating they originate in dense, star-forming regions, rather than in a diffuse, quiescent gas. |
| In the text | |
|
Fig. 5. Half-light radii of CO(1–0) and [C II] emission vs. star formation rate (left) and total molecular gas mass (right) for galaxies from our sample and from the literature (see Section 4.1 for references). The protoclusters from Emonts et al. (2016) and Dannerbauer et al. (2017) are highlighted by circles, and open symbols indicate lensed sources from Stanley et al. (2023). We also show predictions for z = 3.1 galaxies from the SIMBA simulation (Davé et al. 2019) as open grey symbols, and the grey lines indicate the running average. The inferred size of the CO(1–0) emission in our sample is consistent with the extended CO(1–0) and [C II] reservoirs around other high-redshift DSFGs with a comparable SFR. |
| In the text | |
Current usage metrics show cumulative count of Article Views (full-text article views including HTML views, PDF and ePub downloads, according to the available data) and Abstracts Views on Vision4Press platform.
Data correspond to usage on the plateform after 2015. The current usage metrics is available 48-96 hours after online publication and is updated daily on week days.
Initial download of the metrics may take a while.