Fig. 5.
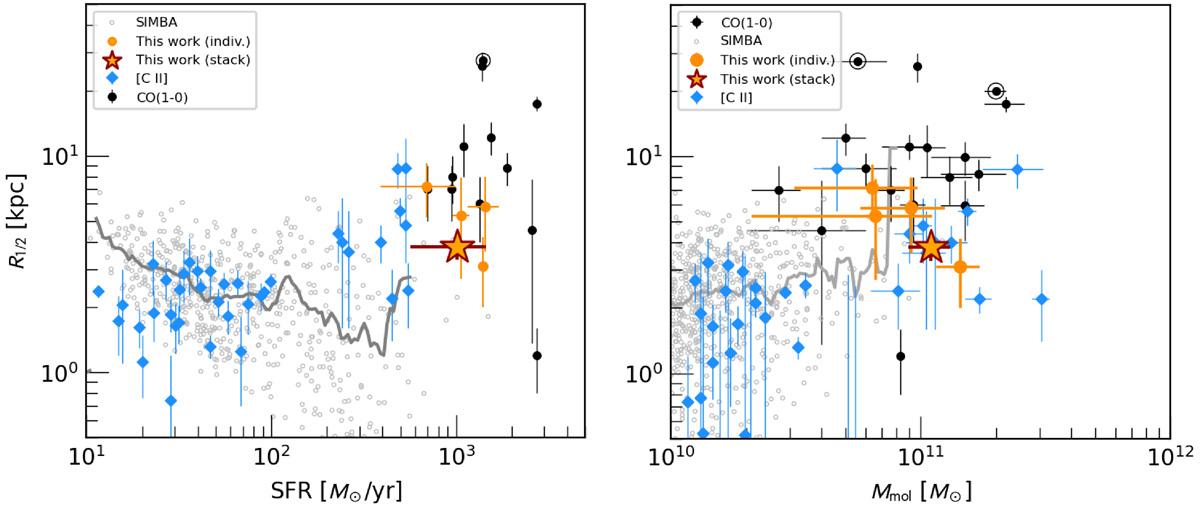
Download original image
Half-light radii of CO(1–0) and [C II] emission vs. star formation rate (left) and total molecular gas mass (right) for galaxies from our sample and from the literature (see Section 4.1 for references). The protoclusters from Emonts et al. (2016) and Dannerbauer et al. (2017) are highlighted by circles, and open symbols indicate lensed sources from Stanley et al. (2023). We also show predictions for z = 3.1 galaxies from the SIMBA simulation (Davé et al. 2019) as open grey symbols, and the grey lines indicate the running average. The inferred size of the CO(1–0) emission in our sample is consistent with the extended CO(1–0) and [C II] reservoirs around other high-redshift DSFGs with a comparable SFR.
Current usage metrics show cumulative count of Article Views (full-text article views including HTML views, PDF and ePub downloads, according to the available data) and Abstracts Views on Vision4Press platform.
Data correspond to usage on the plateform after 2015. The current usage metrics is available 48-96 hours after online publication and is updated daily on week days.
Initial download of the metrics may take a while.