Fig. 1.
Download original image
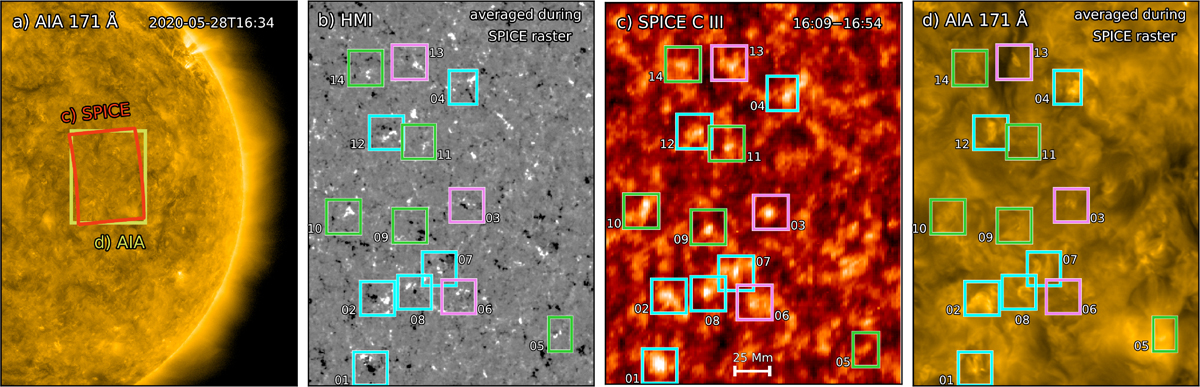
Overview of our observations. Panel a shows a context image from AIA 171 Å, where the red box outlines the SPICE field of view, which is displayed in panel c (C III 977 Å intensity map). The corresponding SDO field of view is outlined with the yellow box and is shown in panels b (HMI line-of-sight magnetogram) and d (AIA 171 Å). The boxes in panels b–d (side length of ≈24 Mm) highlight the 14 bright points we analyzed, which exhibited predominantly flux emergence (blue), flux cancellation (violet), or random motion of the footpoints (green; Sect. 3.2.3). The images in panels a, c, and d are in logarithmic scaling. Those in panels b and d are averaged during the SPICE raster, and their evolution is available in an online movie that spans eight hours centered around the SPICE raster (Sect. 2).
Current usage metrics show cumulative count of Article Views (full-text article views including HTML views, PDF and ePub downloads, according to the available data) and Abstracts Views on Vision4Press platform.
Data correspond to usage on the plateform after 2015. The current usage metrics is available 48-96 hours after online publication and is updated daily on week days.
Initial download of the metrics may take a while.