Fig. 2.
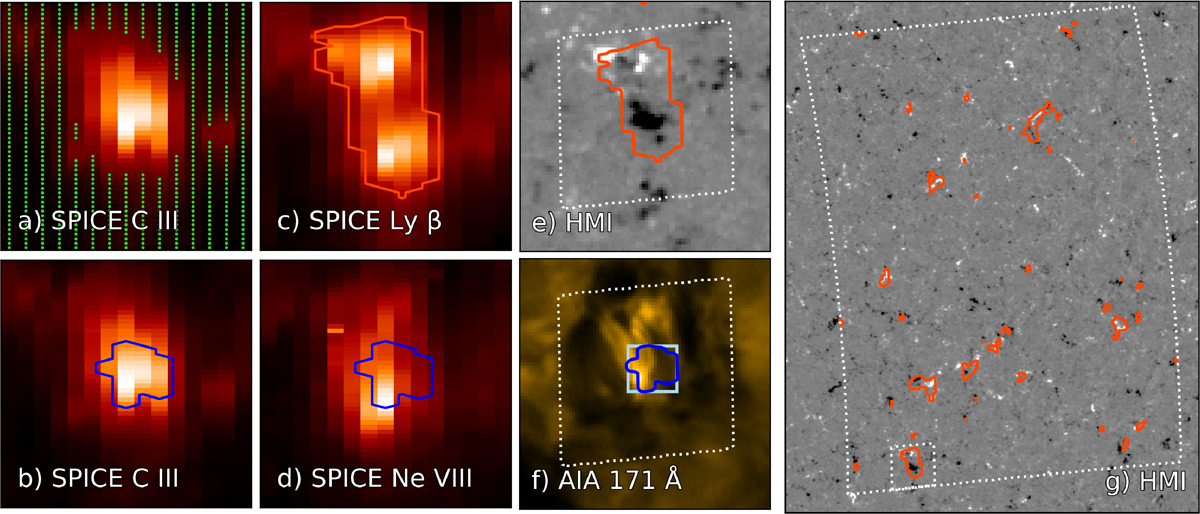
Download original image
Bright point 01 throughout the solar atmosphere. We show bright point 01 as recorded with different instruments and in different spectral ranges, as annotated. The green dots in panel a mark the pixels we used to estimate the average background spectrum. The dark blue contour in panels b and d outlines the bright-point pixels selected in the SPICE data. The orange contour in panel c outlines the brightening in Lyβ, which we used to align the SPICE data to HMI. In panels e and f, we overplot the contours from panels c and d, respectively, after reprojecting them onto the AIA coordinate grid. The dotted white square represents the field of view of panels a–d (roughly 24 × 24 Mm) after the reprojection. The light blue box in panel f outlines the bright-point pixels selected in the AIA data. In panel g we show the overlap between the various analyzed brightenings in Lyβ and the magnetic field concentrations across the whole field of view (see Sect. 2.3). All panels from SPICE and AIA are scaled linearly between minimum and maximum values.
Current usage metrics show cumulative count of Article Views (full-text article views including HTML views, PDF and ePub downloads, according to the available data) and Abstracts Views on Vision4Press platform.
Data correspond to usage on the plateform after 2015. The current usage metrics is available 48-96 hours after online publication and is updated daily on week days.
Initial download of the metrics may take a while.