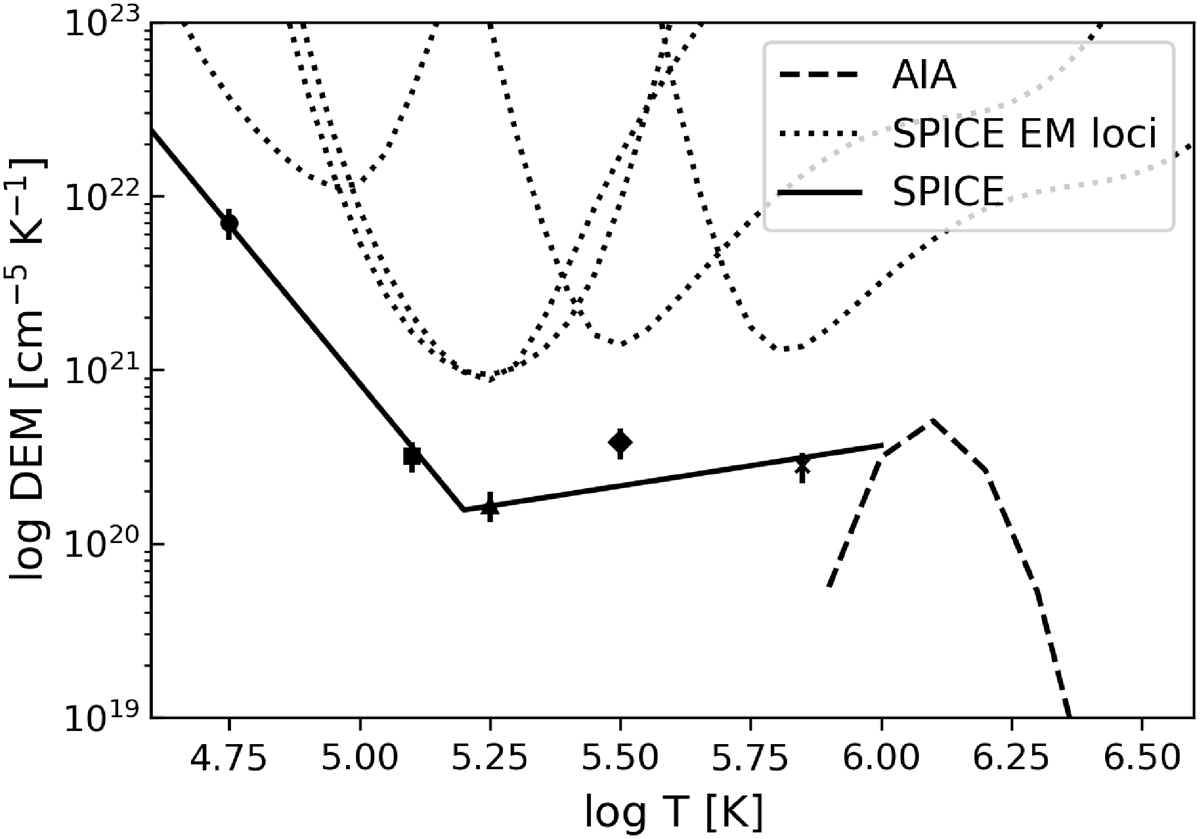
Fig. 3.
Download original image
Differential emission measure of the average quiet Sun. The input intensity of the quiet Sun is spatially averaged over the whole SPICE (and the corresponding AIA) field of view. The solid line depicts the DEM profile derived from the SPICE data. Each emission line (see Table 1) is represented with a diamond at its effective line formation temperature, as derived with the DEM procedure. The offset of each diamond to the DEM curve indicates the ratio of the observed line intensity to the one derived from the DEM. The bars represent the errors of the observed line intensities. The dotted lines display the emission measure loci for the SPICE emission lines. The dashed line depicts the DEM profile as determined using the AIA data. See Sect. 3.1.
Current usage metrics show cumulative count of Article Views (full-text article views including HTML views, PDF and ePub downloads, according to the available data) and Abstracts Views on Vision4Press platform.
Data correspond to usage on the plateform after 2015. The current usage metrics is available 48-96 hours after online publication and is updated daily on week days.
Initial download of the metrics may take a while.