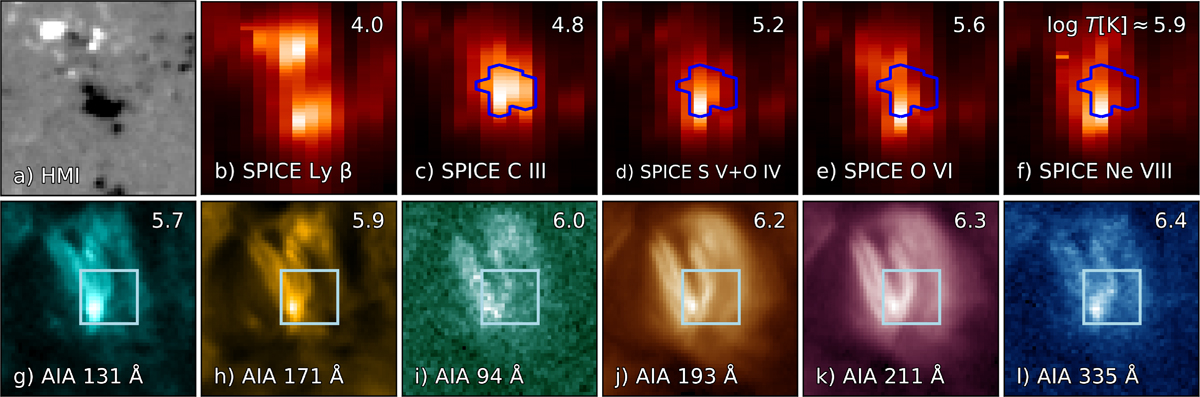
Fig. 4.
Download original image
Overview of the bright point 01 observations. We show spectral and imaging diagnostics, along with the surface magnetic fields, for bright point 01, as labeled in each panel. Both the SPICE and the SDO data are shown in their original view plane and plate scale, and images are scaled linearly between minimum and maximum values. The SPICE panels have a size of about 24 × 24 Mm. In the top right of each panel, we indicate the temperature (in log T [K]) of the plasma for which the emission line or channel has the highest sensitivity (Table 1). The SDO data are averaged over about 5 minutes, during which time the SPICE slit crossed the bright point. The dark blue contours and the light-blue boxes highlight the pixels selected for the analysis of the bright point, as discussed in Sect. 2.3.
Current usage metrics show cumulative count of Article Views (full-text article views including HTML views, PDF and ePub downloads, according to the available data) and Abstracts Views on Vision4Press platform.
Data correspond to usage on the plateform after 2015. The current usage metrics is available 48-96 hours after online publication and is updated daily on week days.
Initial download of the metrics may take a while.