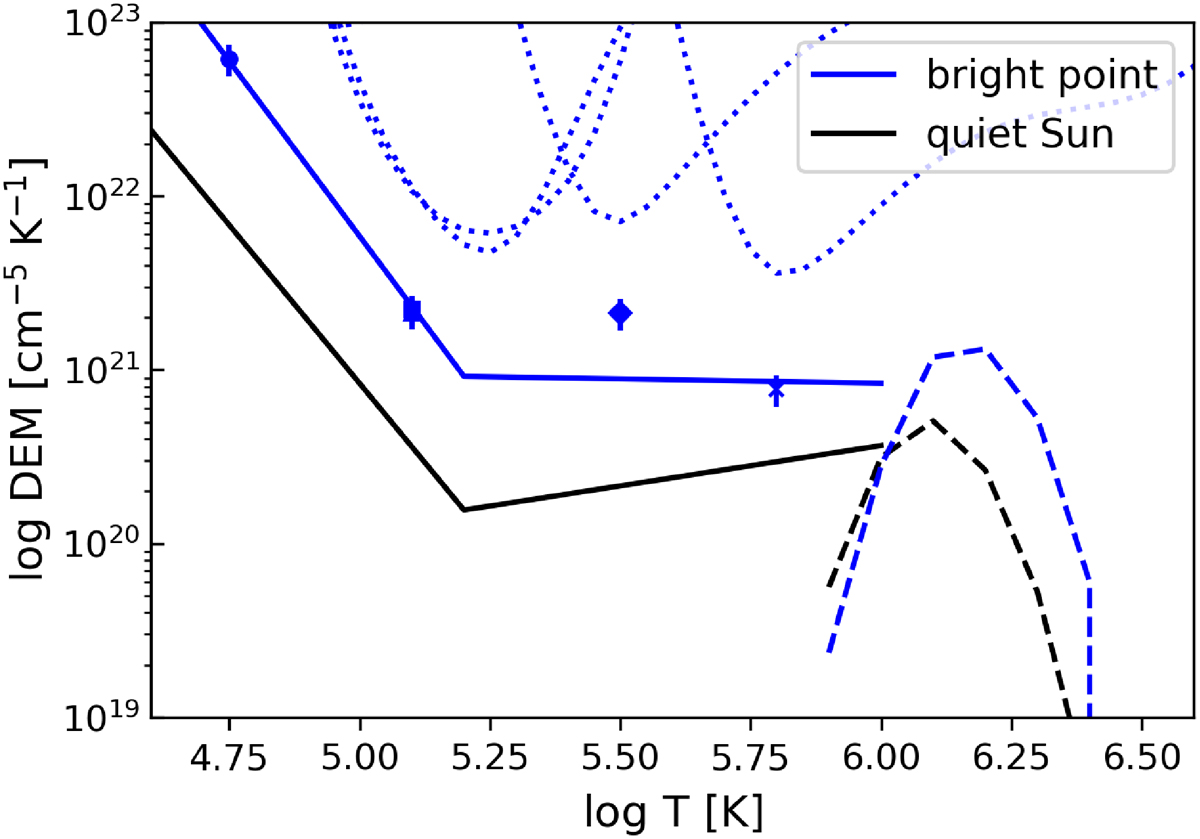
Fig. 5.
Download original image
Differential emission measure of bright point 01 compared to the quiet Sun. The quiet-Sun DEM is computed for spatially averaged intensity over the whole SPICE (and the corresponding AIA) field of view. The choice of the different line styles is the same as in Fig. 3. The results are represented with blue lines for the bright point and black lines for the quiet Sun. See Sect. 3.2.2.
Current usage metrics show cumulative count of Article Views (full-text article views including HTML views, PDF and ePub downloads, according to the available data) and Abstracts Views on Vision4Press platform.
Data correspond to usage on the plateform after 2015. The current usage metrics is available 48-96 hours after online publication and is updated daily on week days.
Initial download of the metrics may take a while.