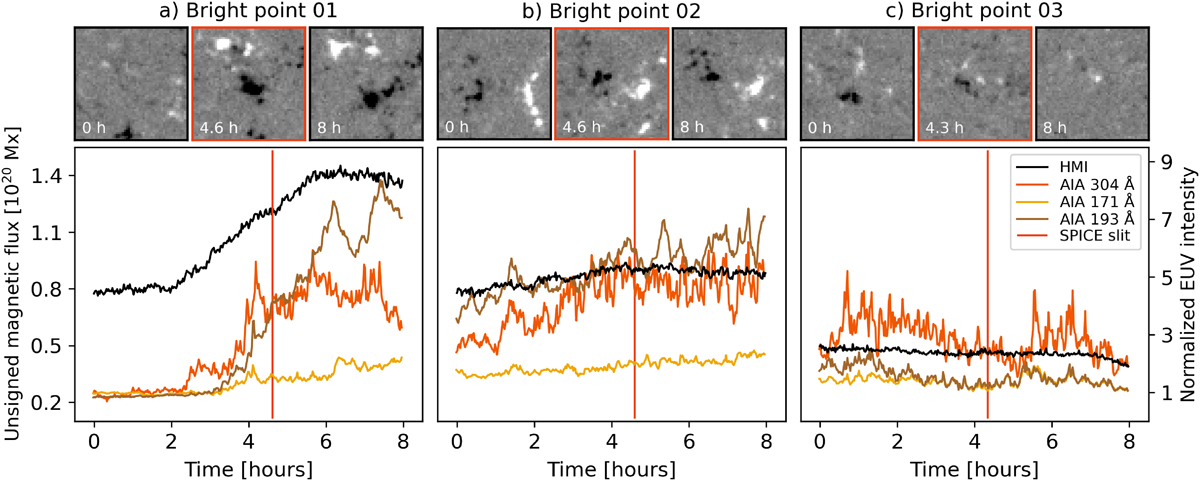
Fig. 8.
Download original image
Evolution of bright points 01, 02, and 03 over the course of 8 hours. In the bottom panels, the orange, yellow, and brown curves depict the variation of the EUV intensity in a specific AIA channel that we spatially averaged within the box we used to calculate the DEM (cf. light-blue boxes in Figs. 4g–l) and normalized to the average quiet-Sun value in the total field of view. The SPICE raster takes place between hours 4 and 4.75 and the vertical red line indicates the time when the SPICE slit crossed over a specific bright point. The black curve depicts the variation of the total unsigned magnetic flux, integrated in the field of view shown in the top panels, including only pixels with signal above the noise level of 10 G. The top panels show snapshots of the line-of-sight magnetogram from HMI, saturated at ±100 G. The snapshots correspond to the beginning, mid-time, and the end of the 8-hour time series (Sect. 2), and cover a field of view of about 24 × 24 Mm (like in Fig. 4a). The evolution of these magnetograms is also available online as a movie.
Current usage metrics show cumulative count of Article Views (full-text article views including HTML views, PDF and ePub downloads, according to the available data) and Abstracts Views on Vision4Press platform.
Data correspond to usage on the plateform after 2015. The current usage metrics is available 48-96 hours after online publication and is updated daily on week days.
Initial download of the metrics may take a while.