Fig. 9.
Download original image
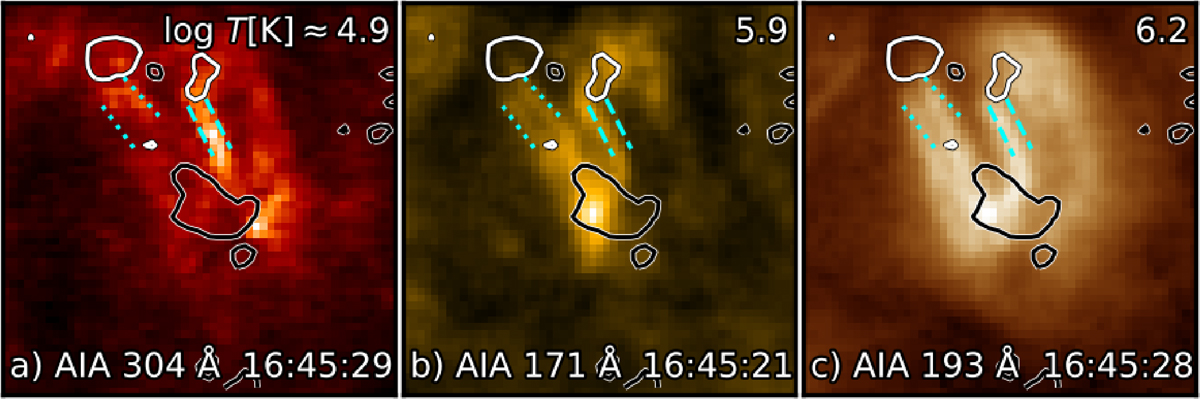
Loops in bright point 01. We show single snapshots of bright point 01 in different AIA channels, as labeled in each panel. We indicate in the top right the temperature of plasma (in log T [K]) for which the channel has the highest sensitivity (Table 1). The field of view is like in Fig. 4, and the images are scaled linearly between minimum and maximum values. The black and white contours in all panels outline the magnetic field from HMI at values of −50 G and +50 G, respectively. The dashed and dotted blue lines highlight loop-like features from 304 Å and 171 Å channels, respectively, as discussed in Sect. 4.1.
Current usage metrics show cumulative count of Article Views (full-text article views including HTML views, PDF and ePub downloads, according to the available data) and Abstracts Views on Vision4Press platform.
Data correspond to usage on the plateform after 2015. The current usage metrics is available 48-96 hours after online publication and is updated daily on week days.
Initial download of the metrics may take a while.