Fig. 7.
Download original image
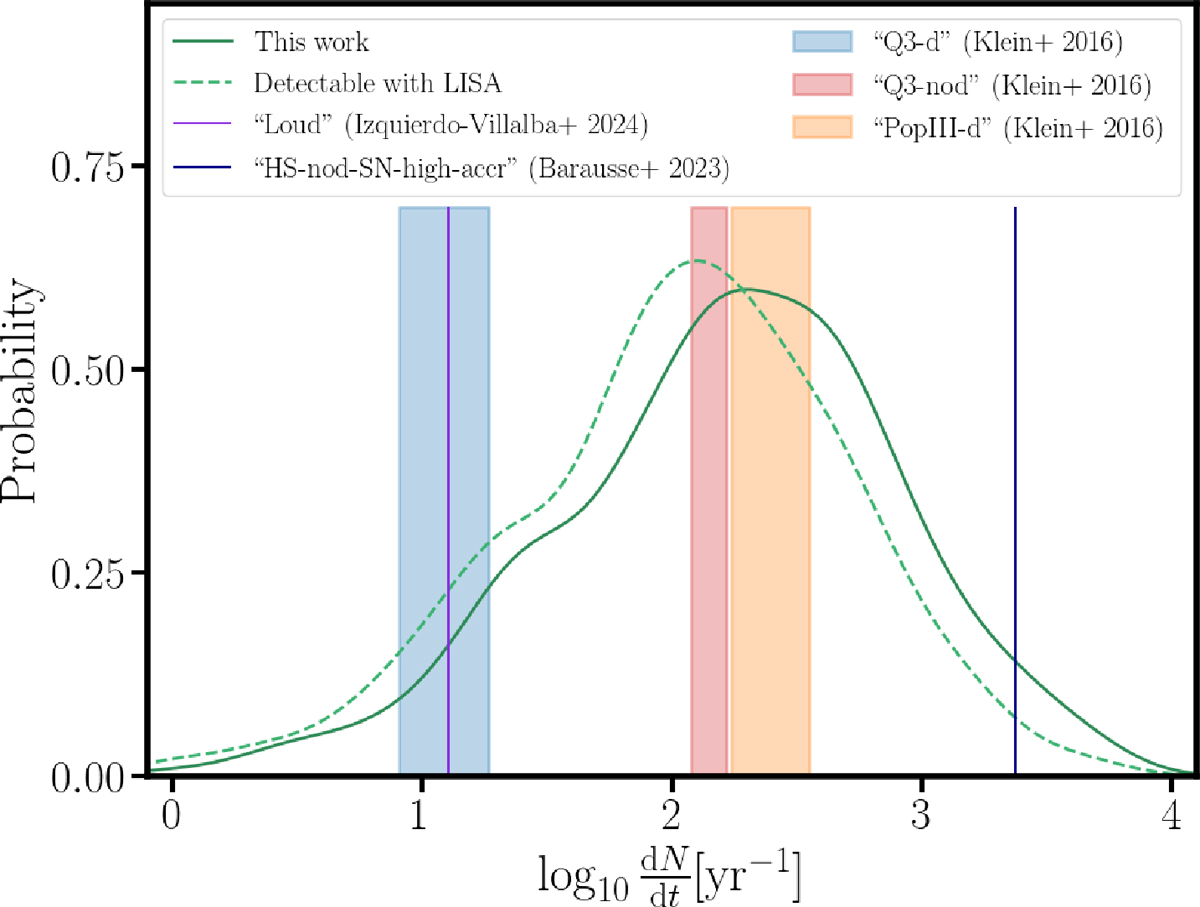
Prediction of the yearly rate of MBH mergers after fitting for the LF and the GW background measured by EPTA. The solid curve shows the intrinsic rate, the dotted one the rate of detetable events, assuming an S/N threshold of 10. For comparison, we also report the predictions for the intrinsic rate of other models from the literature (see text for description). For Q3-nod, Q3-d and PopIII-d, the shaded areas show the range reported in reference Barausse et al. (2023) (the lower bound corresponding to finite resolution results, and the upper bound to results extrapolated to infinite resolution). For model HS-nod-SN-high-accr, we only report finite resolution results (i.e. a lower bound) as the extrapolation was not provided in reference Barausse et al. (2023).
Current usage metrics show cumulative count of Article Views (full-text article views including HTML views, PDF and ePub downloads, according to the available data) and Abstracts Views on Vision4Press platform.
Data correspond to usage on the plateform after 2015. The current usage metrics is available 48-96 hours after online publication and is updated daily on week days.
Initial download of the metrics may take a while.