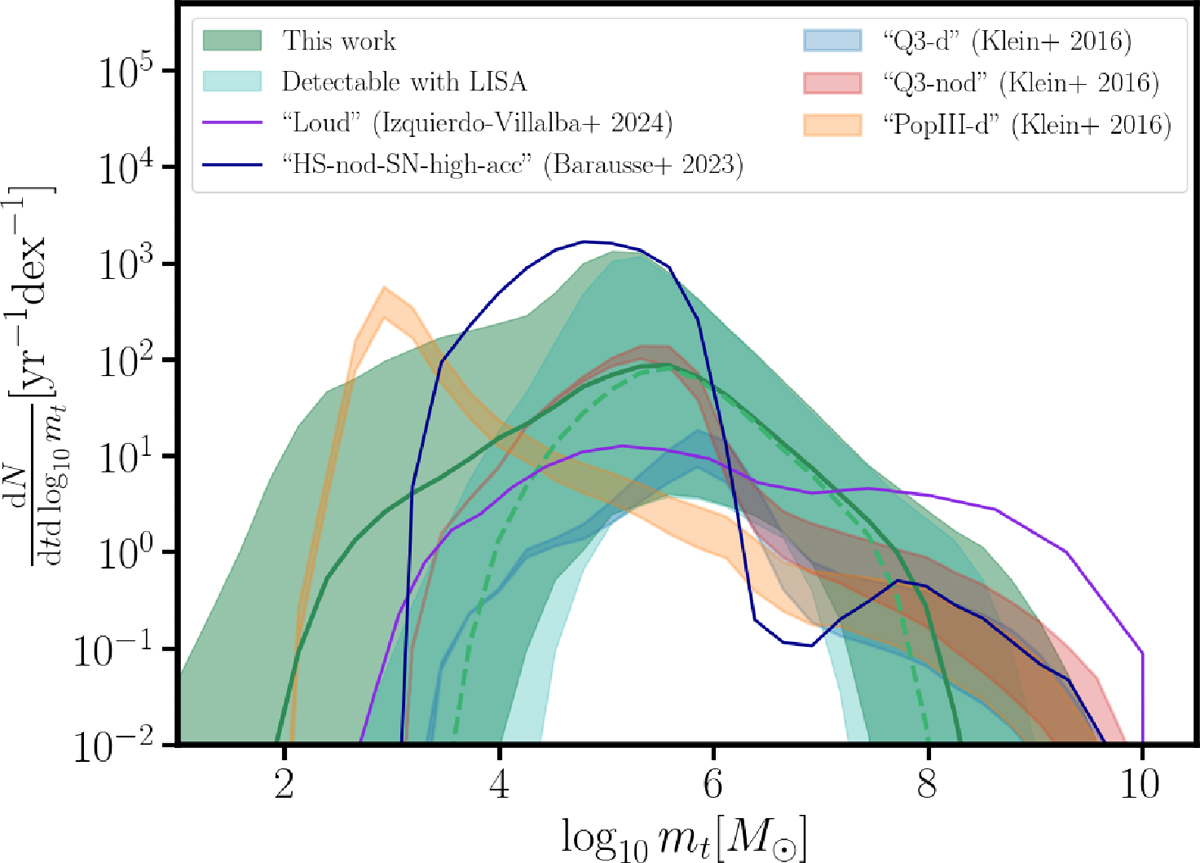
Fig. 8.
Download original image
Prediction of the yearly rate of mergers as a function of the total source-frame mass of the binary. Thick lines show the median and shaded areas the 90% confidence region after fitting for the LF and the GW background of EPTA. The green curves correspond to the intrinsic merger rate, while the light green curves show the rate of events detectable by LISA, assuming an S/N threshold of 10. Predictions from other models are included for comparison.
Current usage metrics show cumulative count of Article Views (full-text article views including HTML views, PDF and ePub downloads, according to the available data) and Abstracts Views on Vision4Press platform.
Data correspond to usage on the plateform after 2015. The current usage metrics is available 48-96 hours after online publication and is updated daily on week days.
Initial download of the metrics may take a while.