Fig. 12
Download original image
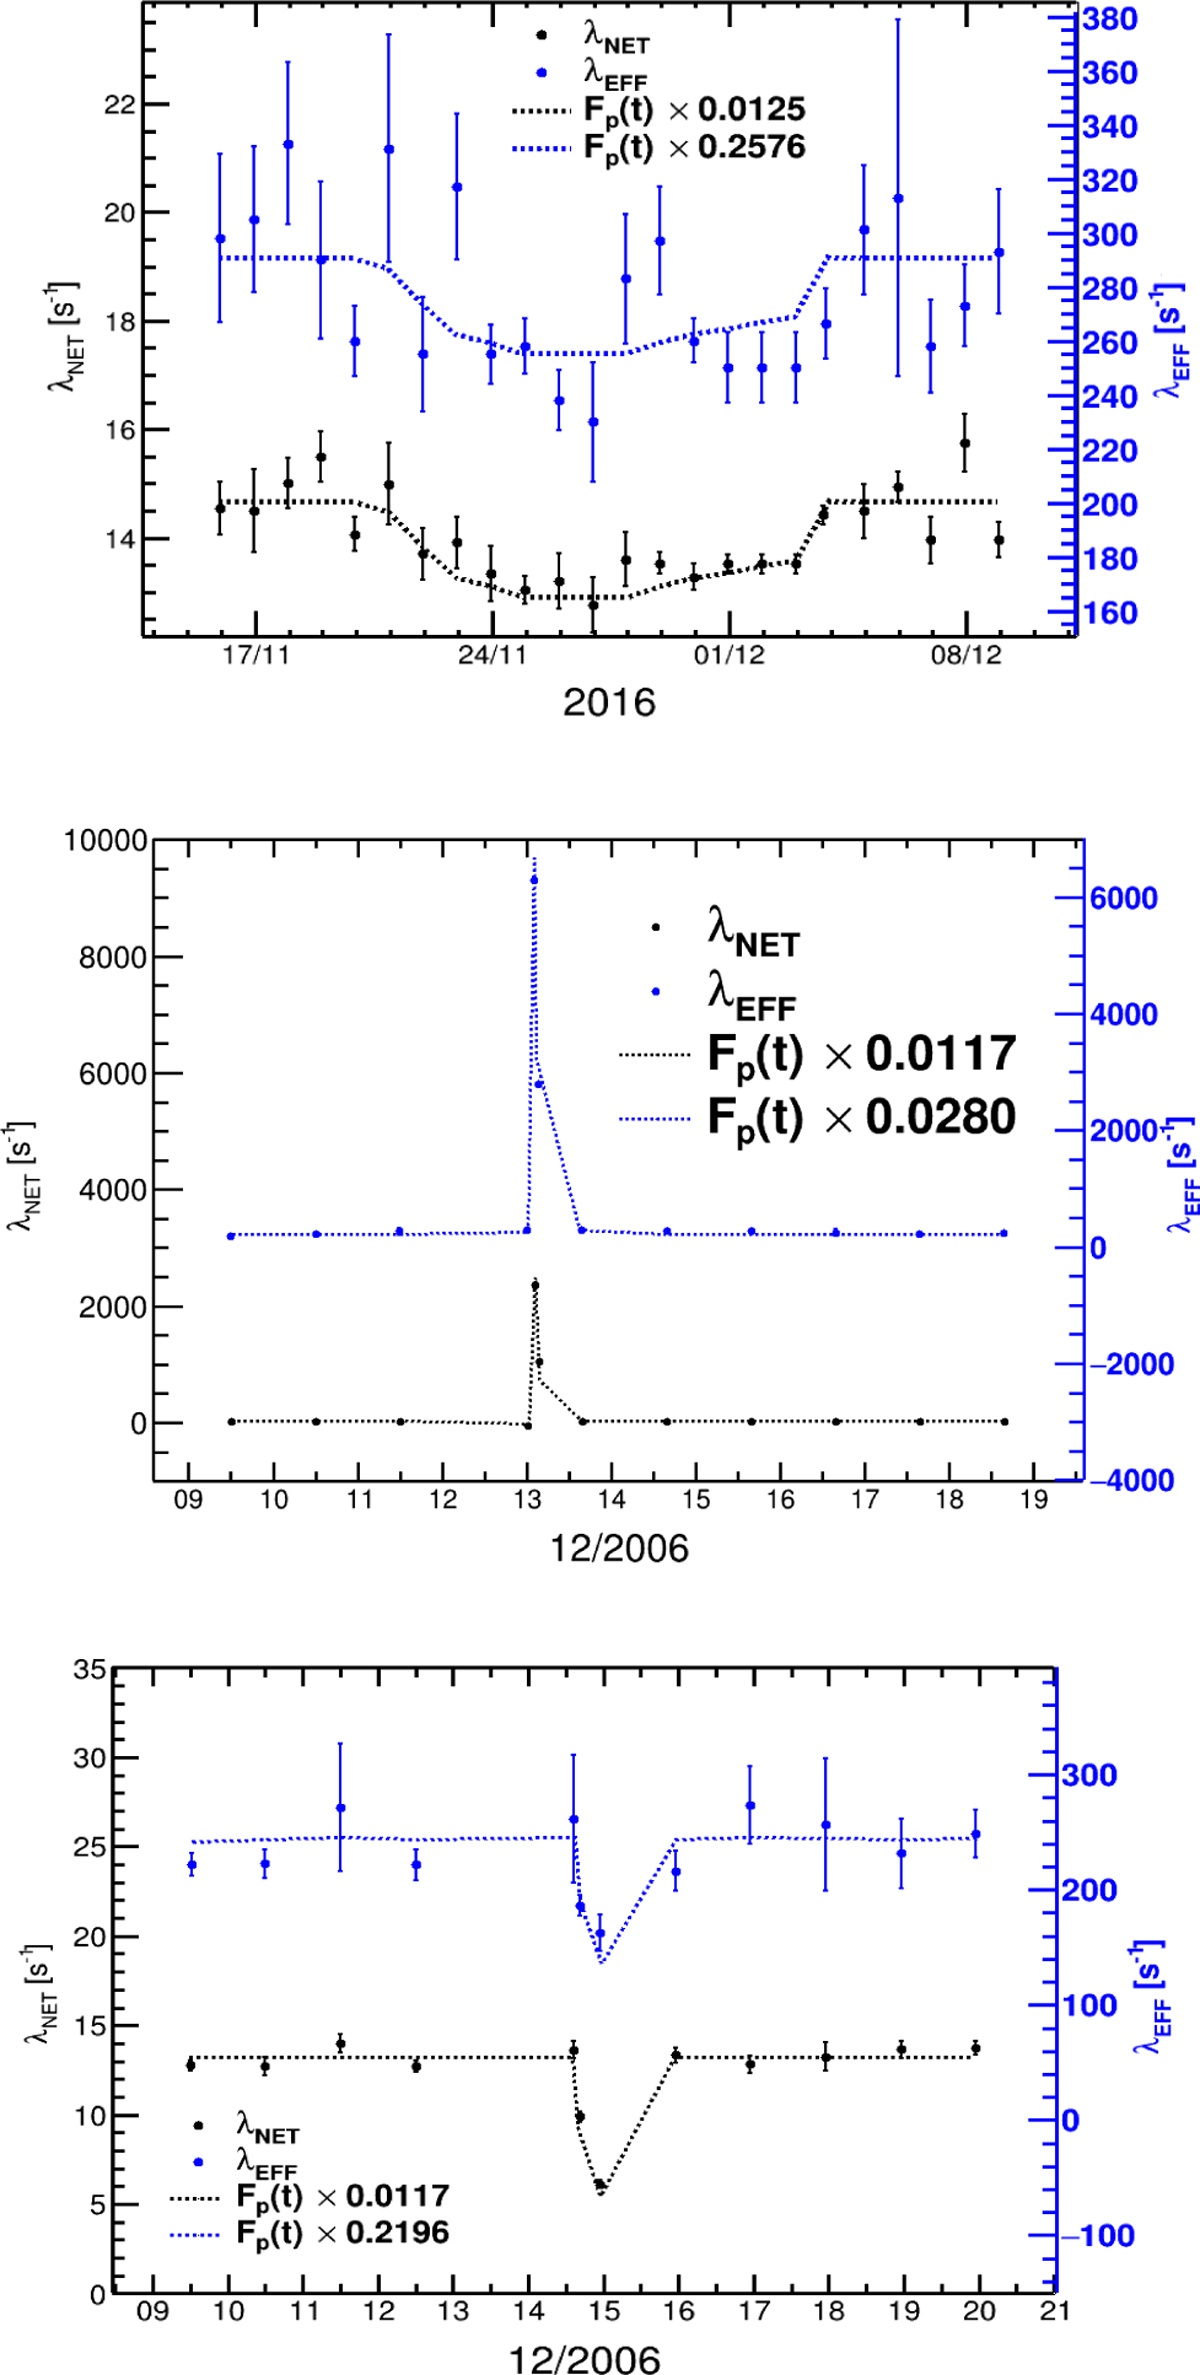
Top panel: Net (black points) and effective (blue points) charging of the LISA TM during the recurrent GCR variation associated with the passage of one high-speed solar wind stream observed with LPF in November 2016. Only the proton flux was simulated. As a comparison, the trend of the simulated proton flux Fp(t), integrated in the 0.5–1.5 GV rigidity bin, was superimposed on the λNET and λEFF data through multiplication by a constant (dashed lines). Central panel: Net (black points) and effective (blue points) charging of the LISA TM during the SEP event of December 13, 2006. The dashed lines show the same comparison as in the top panel with the normalized proton flux. Bottom panel: Net (black points) and effective (blue points) charging of the LISA TM during the Forbush decrease following the SEP event of December 13, 2006 (SEPs were subtracted from the data). The dashed lines show the same comparison as in the top panel with the normalized proton flux.
Current usage metrics show cumulative count of Article Views (full-text article views including HTML views, PDF and ePub downloads, according to the available data) and Abstracts Views on Vision4Press platform.
Data correspond to usage on the plateform after 2015. The current usage metrics is available 48-96 hours after online publication and is updated daily on week days.
Initial download of the metrics may take a while.