Open Access
Fig. 5
Download original image
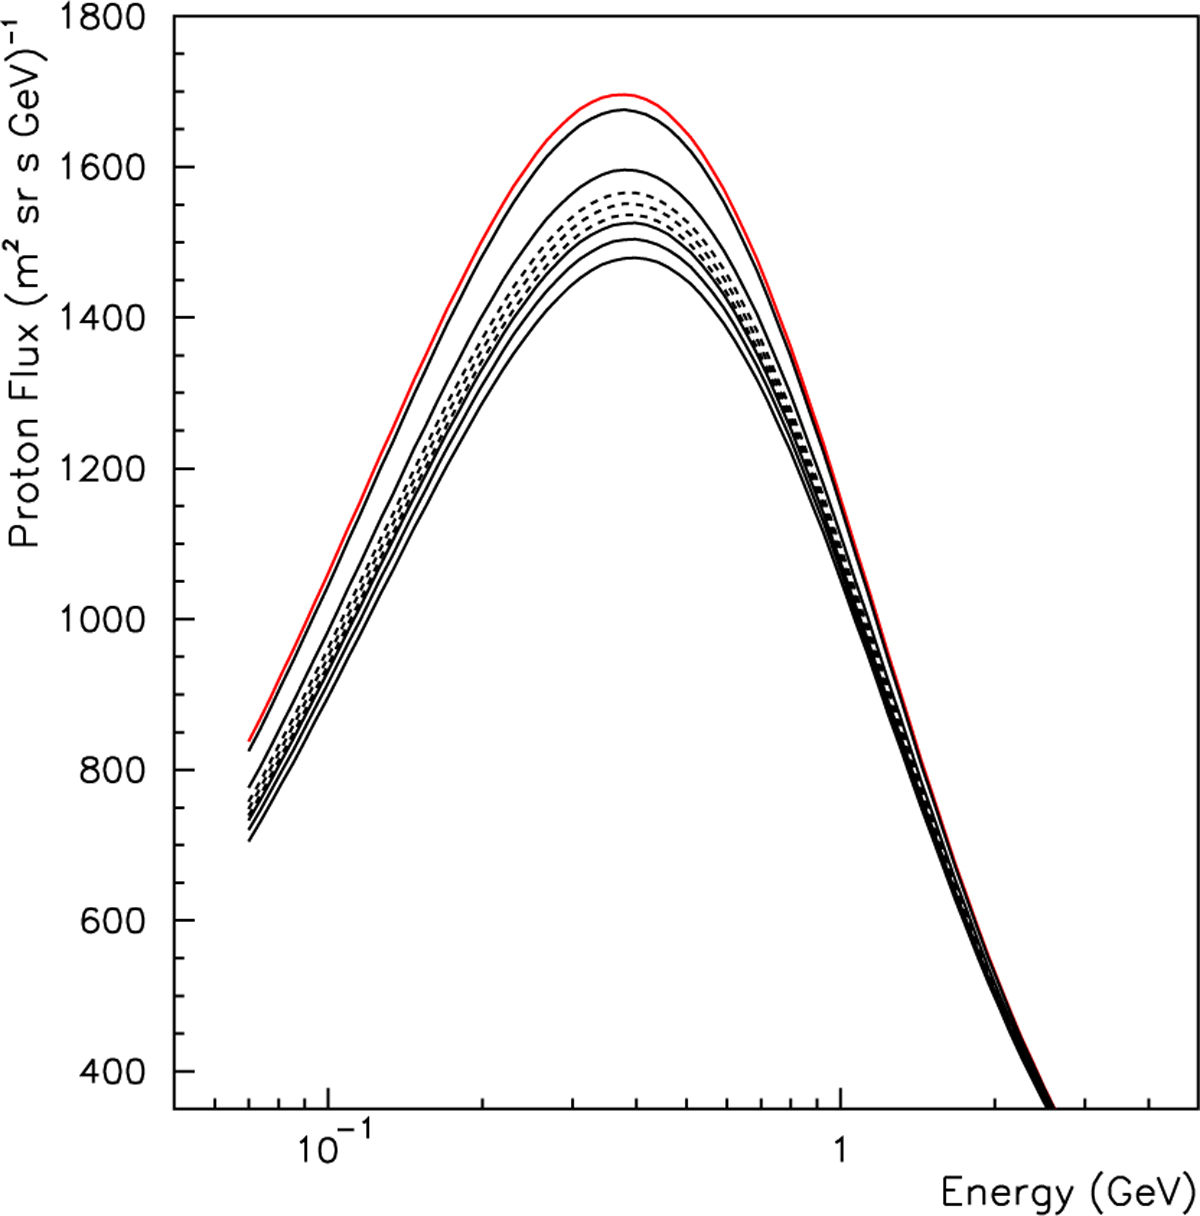
Recurrent short-term variations of GCRs observed with LPF between November 21 and December 4, 2016. The continuous lines indicate the decrease phase, and the dashed lines show the recovery phase. The top continuous red line indicates the proton energy spectrum at the onset of the event.
Current usage metrics show cumulative count of Article Views (full-text article views including HTML views, PDF and ePub downloads, according to the available data) and Abstracts Views on Vision4Press platform.
Data correspond to usage on the plateform after 2015. The current usage metrics is available 48-96 hours after online publication and is updated daily on week days.
Initial download of the metrics may take a while.