Fig. 4.
Download original image
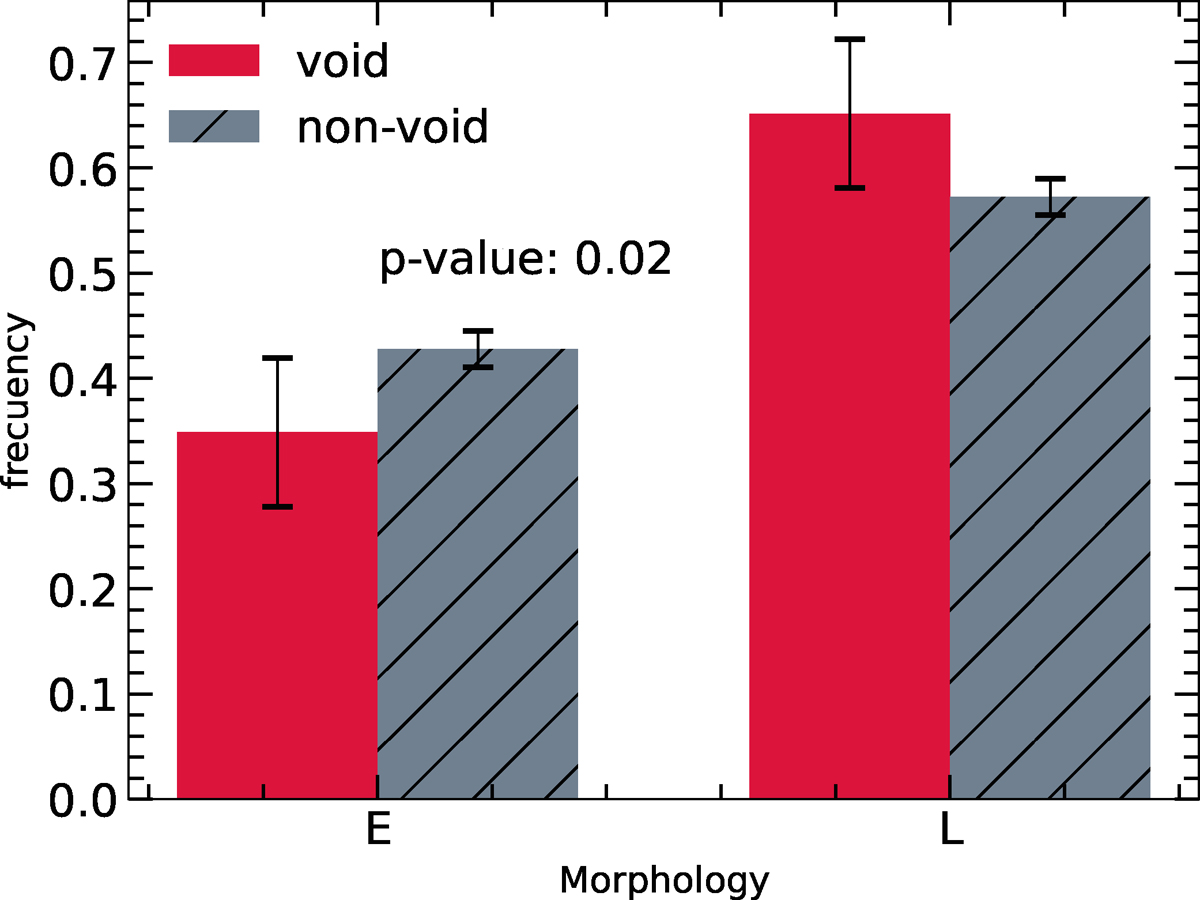
Fraction of ETGs and LTGs in the void (red) and non-void (dashed gray) galaxy samples. Error bars indicate the 95% confidence intervals for each proportion. The figure also shows the p-value from a hypothesis test evaluating whether the proportions of early- and late-type galaxies differ significantly between void and non-void environments.
Current usage metrics show cumulative count of Article Views (full-text article views including HTML views, PDF and ePub downloads, according to the available data) and Abstracts Views on Vision4Press platform.
Data correspond to usage on the plateform after 2015. The current usage metrics is available 48-96 hours after online publication and is updated daily on week days.
Initial download of the metrics may take a while.