Fig. 5.
Download original image
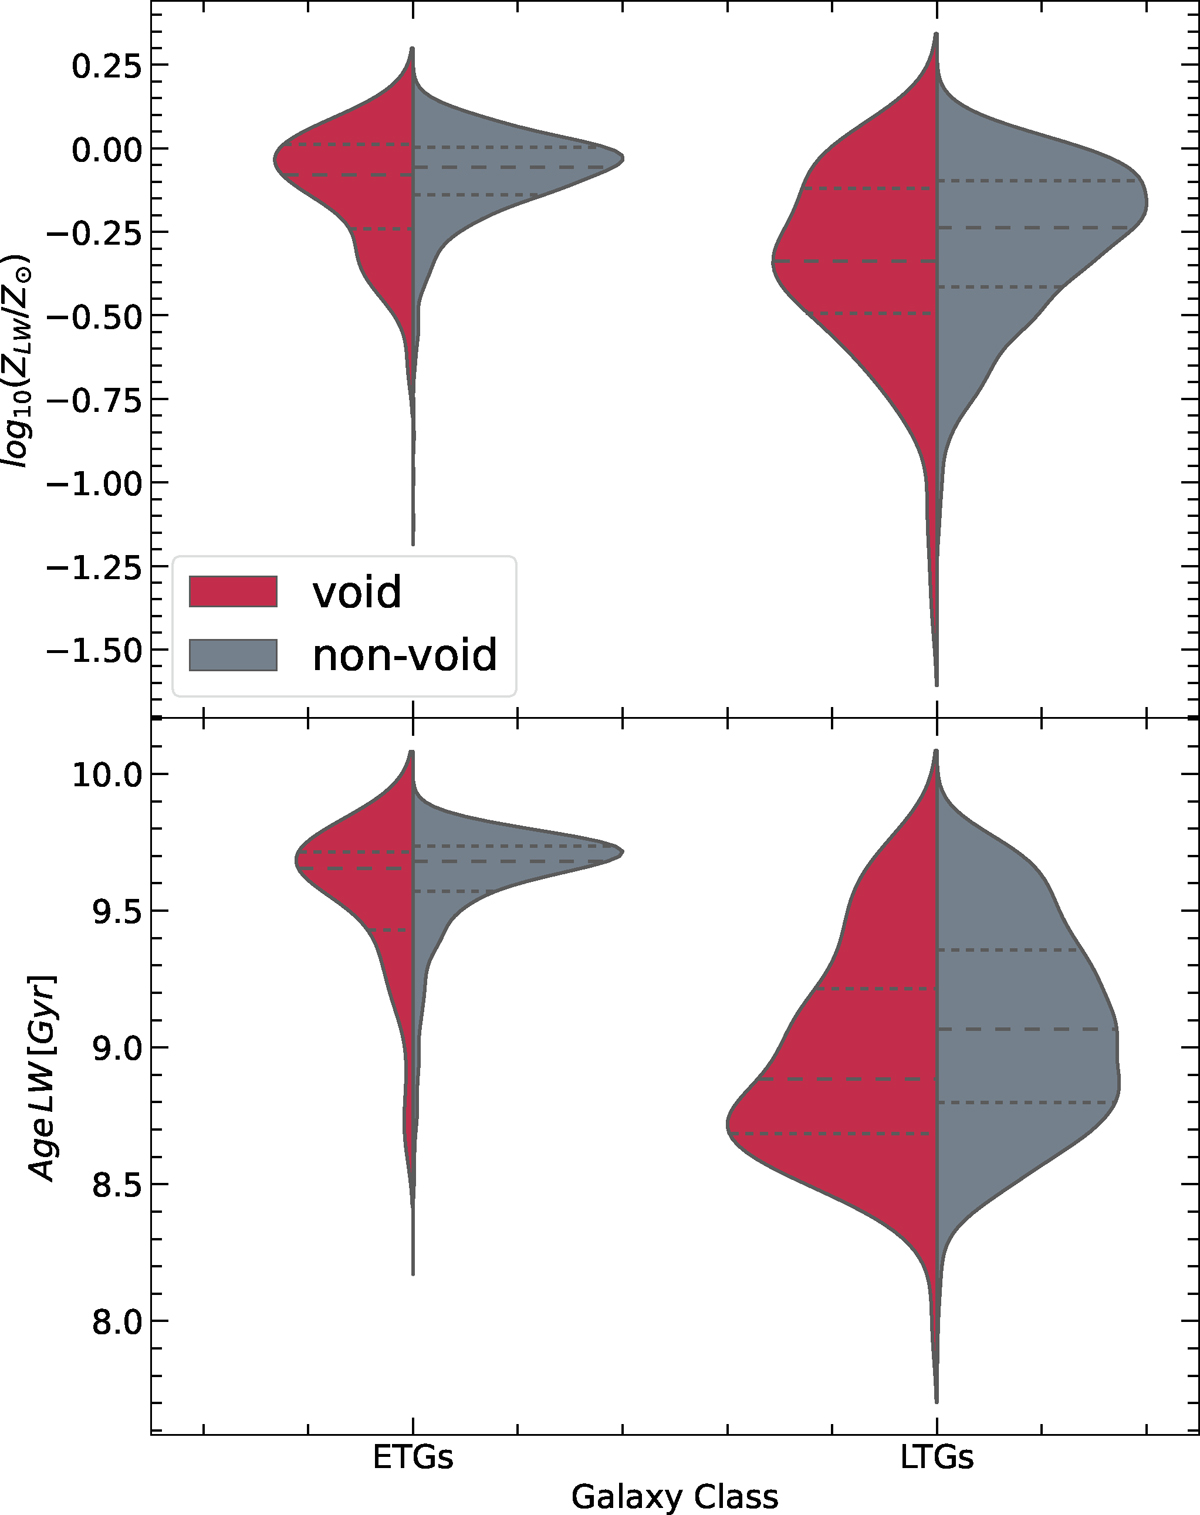
Distribution of stellar properties for void and non-void galaxies, separated by ETGs and LTGs. Top panel: Stellar metallicity. Bottom panel: Galaxy age. In each panel, the left distribution shows ETGs and the right distribution shows LTGs. In each violin plot, the left (red) side represents the void galaxy sample, while the right (gray) side represents the non-void sample. Solid lines within the violin plots indicate the median values and the 25th–75th percentiles.
Current usage metrics show cumulative count of Article Views (full-text article views including HTML views, PDF and ePub downloads, according to the available data) and Abstracts Views on Vision4Press platform.
Data correspond to usage on the plateform after 2015. The current usage metrics is available 48-96 hours after online publication and is updated daily on week days.
Initial download of the metrics may take a while.