Fig. 6.
Download original image
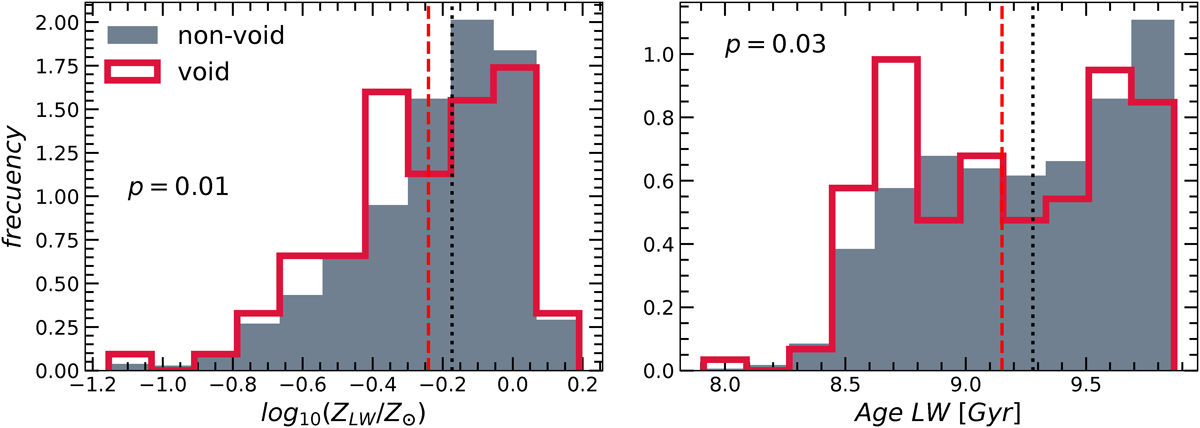
Left panel: Distribution of stellar metallicity for a sample of non-void galaxies that mimics the r-band absolute magnitude distribution of void galaxies. Right panel: The galaxy age distribution for the same samples. The filled gray histogram represents the distribution for non-void galaxies, while the red histogram represents the distribution for void galaxies. A vertical dotted black line indicates the median for the non-void sample, and a dashed red line indicates the median for the void sample in each panel. Each panel also includes the p-value from the KS statistical test.
Current usage metrics show cumulative count of Article Views (full-text article views including HTML views, PDF and ePub downloads, according to the available data) and Abstracts Views on Vision4Press platform.
Data correspond to usage on the plateform after 2015. The current usage metrics is available 48-96 hours after online publication and is updated daily on week days.
Initial download of the metrics may take a while.