Fig. 10.
Download original image
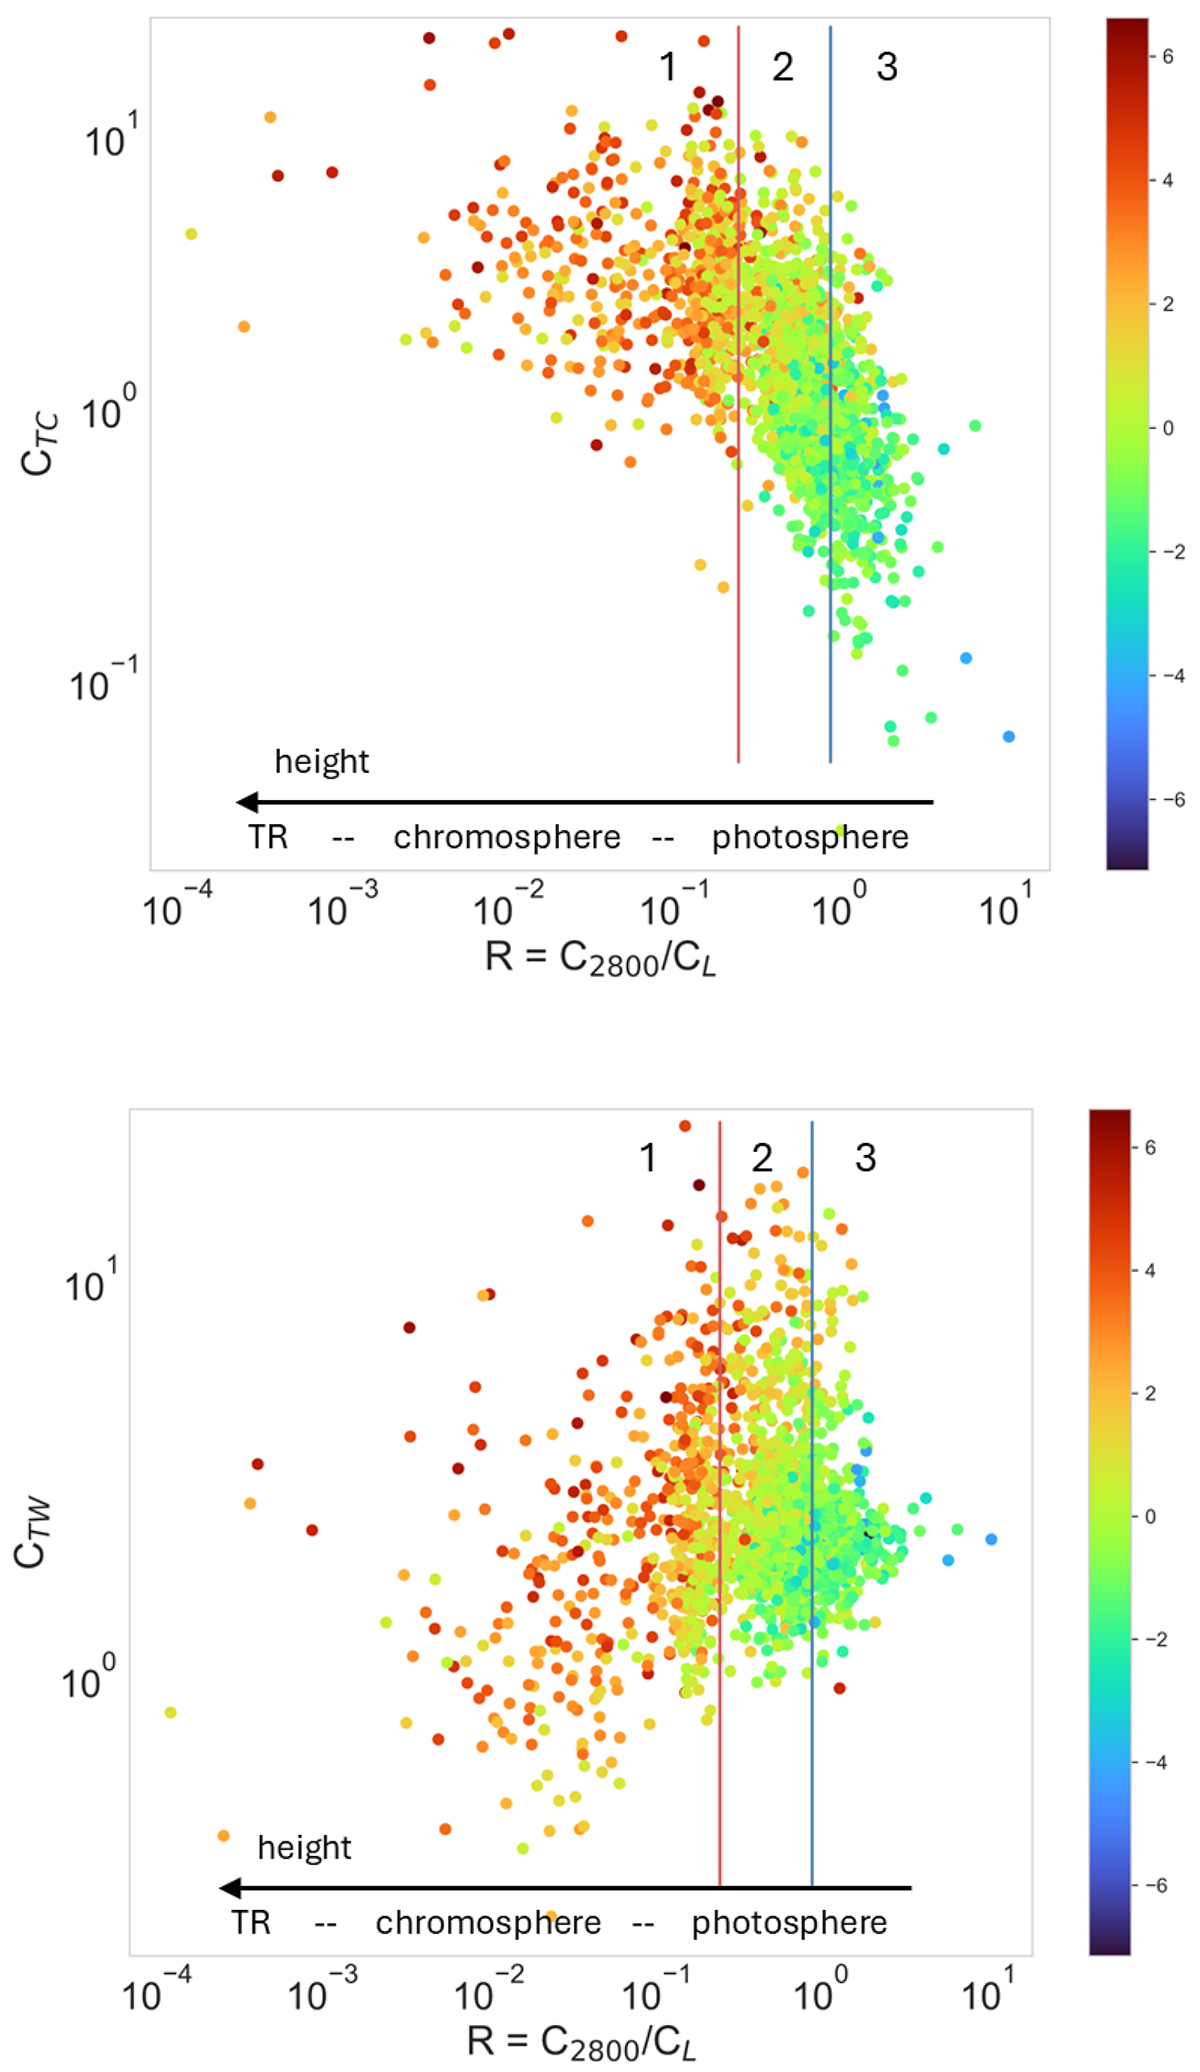
Upper panel: Correlation plot of ratio, R, and CTC. Bottom panel: Correlation plot of R and CTW. The ratio, R (C2800/CL), relates to the atmosphere formation height (Fig. 4). The colors in both plots represent values of logarithm of the ISimean, according to the color bars on the right side. Two vertical lines separate three different types of CBs (defined by C2800/CL), which are marked with the numbers “1,” “2,” and “3” at the top of each plot.
Current usage metrics show cumulative count of Article Views (full-text article views including HTML views, PDF and ePub downloads, according to the available data) and Abstracts Views on Vision4Press platform.
Data correspond to usage on the plateform after 2015. The current usage metrics is available 48-96 hours after online publication and is updated daily on week days.
Initial download of the metrics may take a while.