Fig. 2.
Download original image
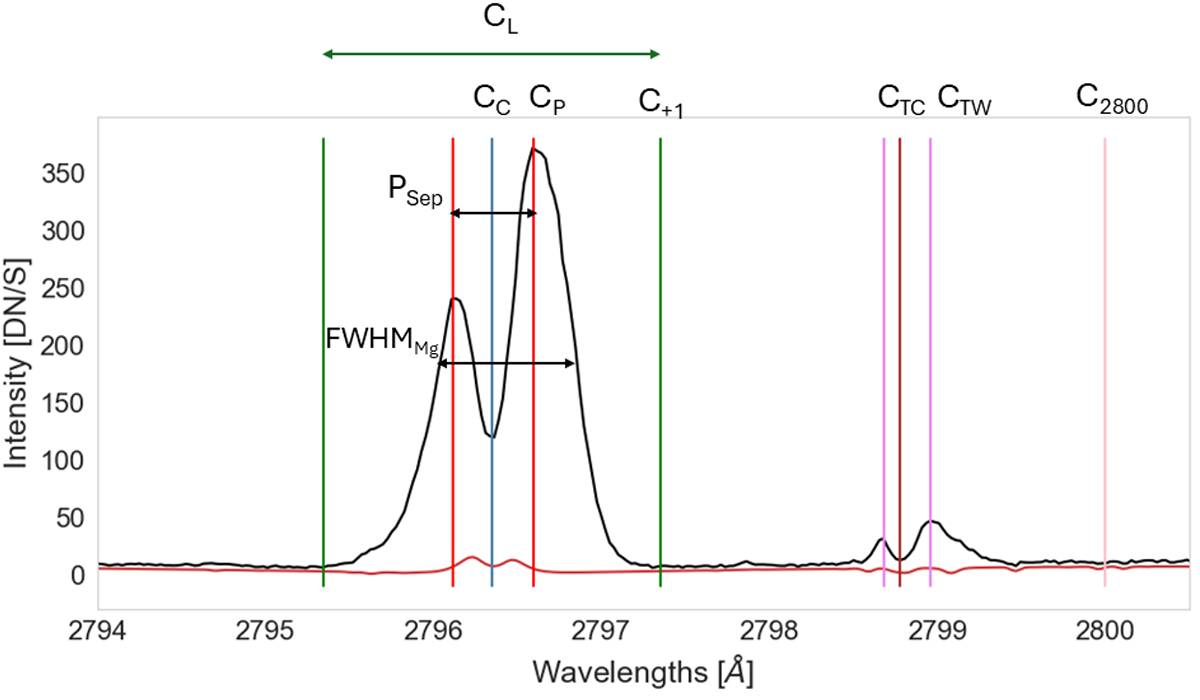
Mg II k and Mg II UV 2 and 3 triplet lines profile. Vertical lines indicate particular wavelengths for which we determined different line parameters defined in Sect. 3 and listed in Table 2. The vertical blue line indicates the k line center and the two vertical red lines the k line peaks. The green are at ±1 Å from k line center. The vertical orange line is at 2800 Å. The vertical brown line and the two pink lines are centered, respectively, at the triplet Mg II UV center and the wings at 0.15 Å.
Current usage metrics show cumulative count of Article Views (full-text article views including HTML views, PDF and ePub downloads, according to the available data) and Abstracts Views on Vision4Press platform.
Data correspond to usage on the plateform after 2015. The current usage metrics is available 48-96 hours after online publication and is updated daily on week days.
Initial download of the metrics may take a while.