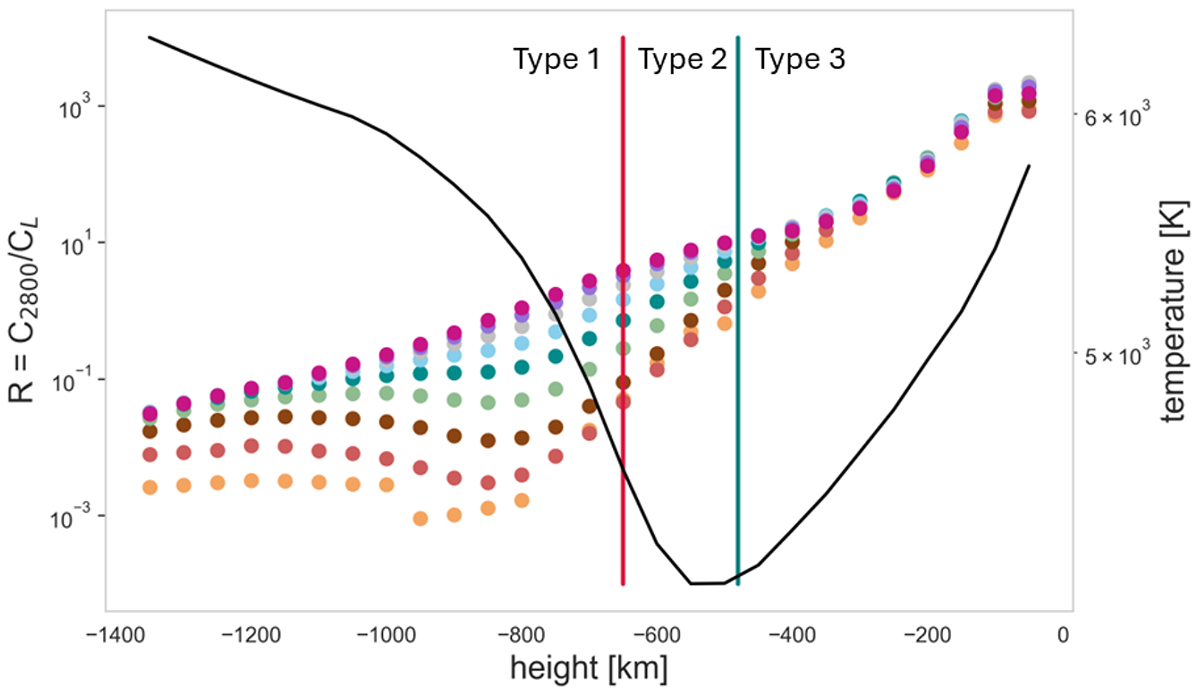
Fig. 4.
Download original image
Theoretical relation between the ratio of R = C2800/CL, (left side of y axis) and formation height of CBs above the photosphere computed using the grid of 243 models (Berlicki & Heinzel 2014; Grubecka Litwicka et al. 2016). Each color represents a different formation temperature from 1100 K (orange, the lowest dots) to 5500 K (pink, the highest dots), with a step of 550 K. Two vertical lines indicate approximately the boundary heights of the formation for three different types of the CBs studied in Grubecka Litwicka et al. (2016). Type 1 CBs form on the left of the red line, Type 2 CBs between the green and red lines, and Type 3 CBs on the right side of the green line. In addition, temperature profile (right side y axis) from VAL C model atmosphere (Vernazza et al. 1981) is overplotted with a solid black line.
Current usage metrics show cumulative count of Article Views (full-text article views including HTML views, PDF and ePub downloads, according to the available data) and Abstracts Views on Vision4Press platform.
Data correspond to usage on the plateform after 2015. The current usage metrics is available 48-96 hours after online publication and is updated daily on week days.
Initial download of the metrics may take a while.