Fig. 5.
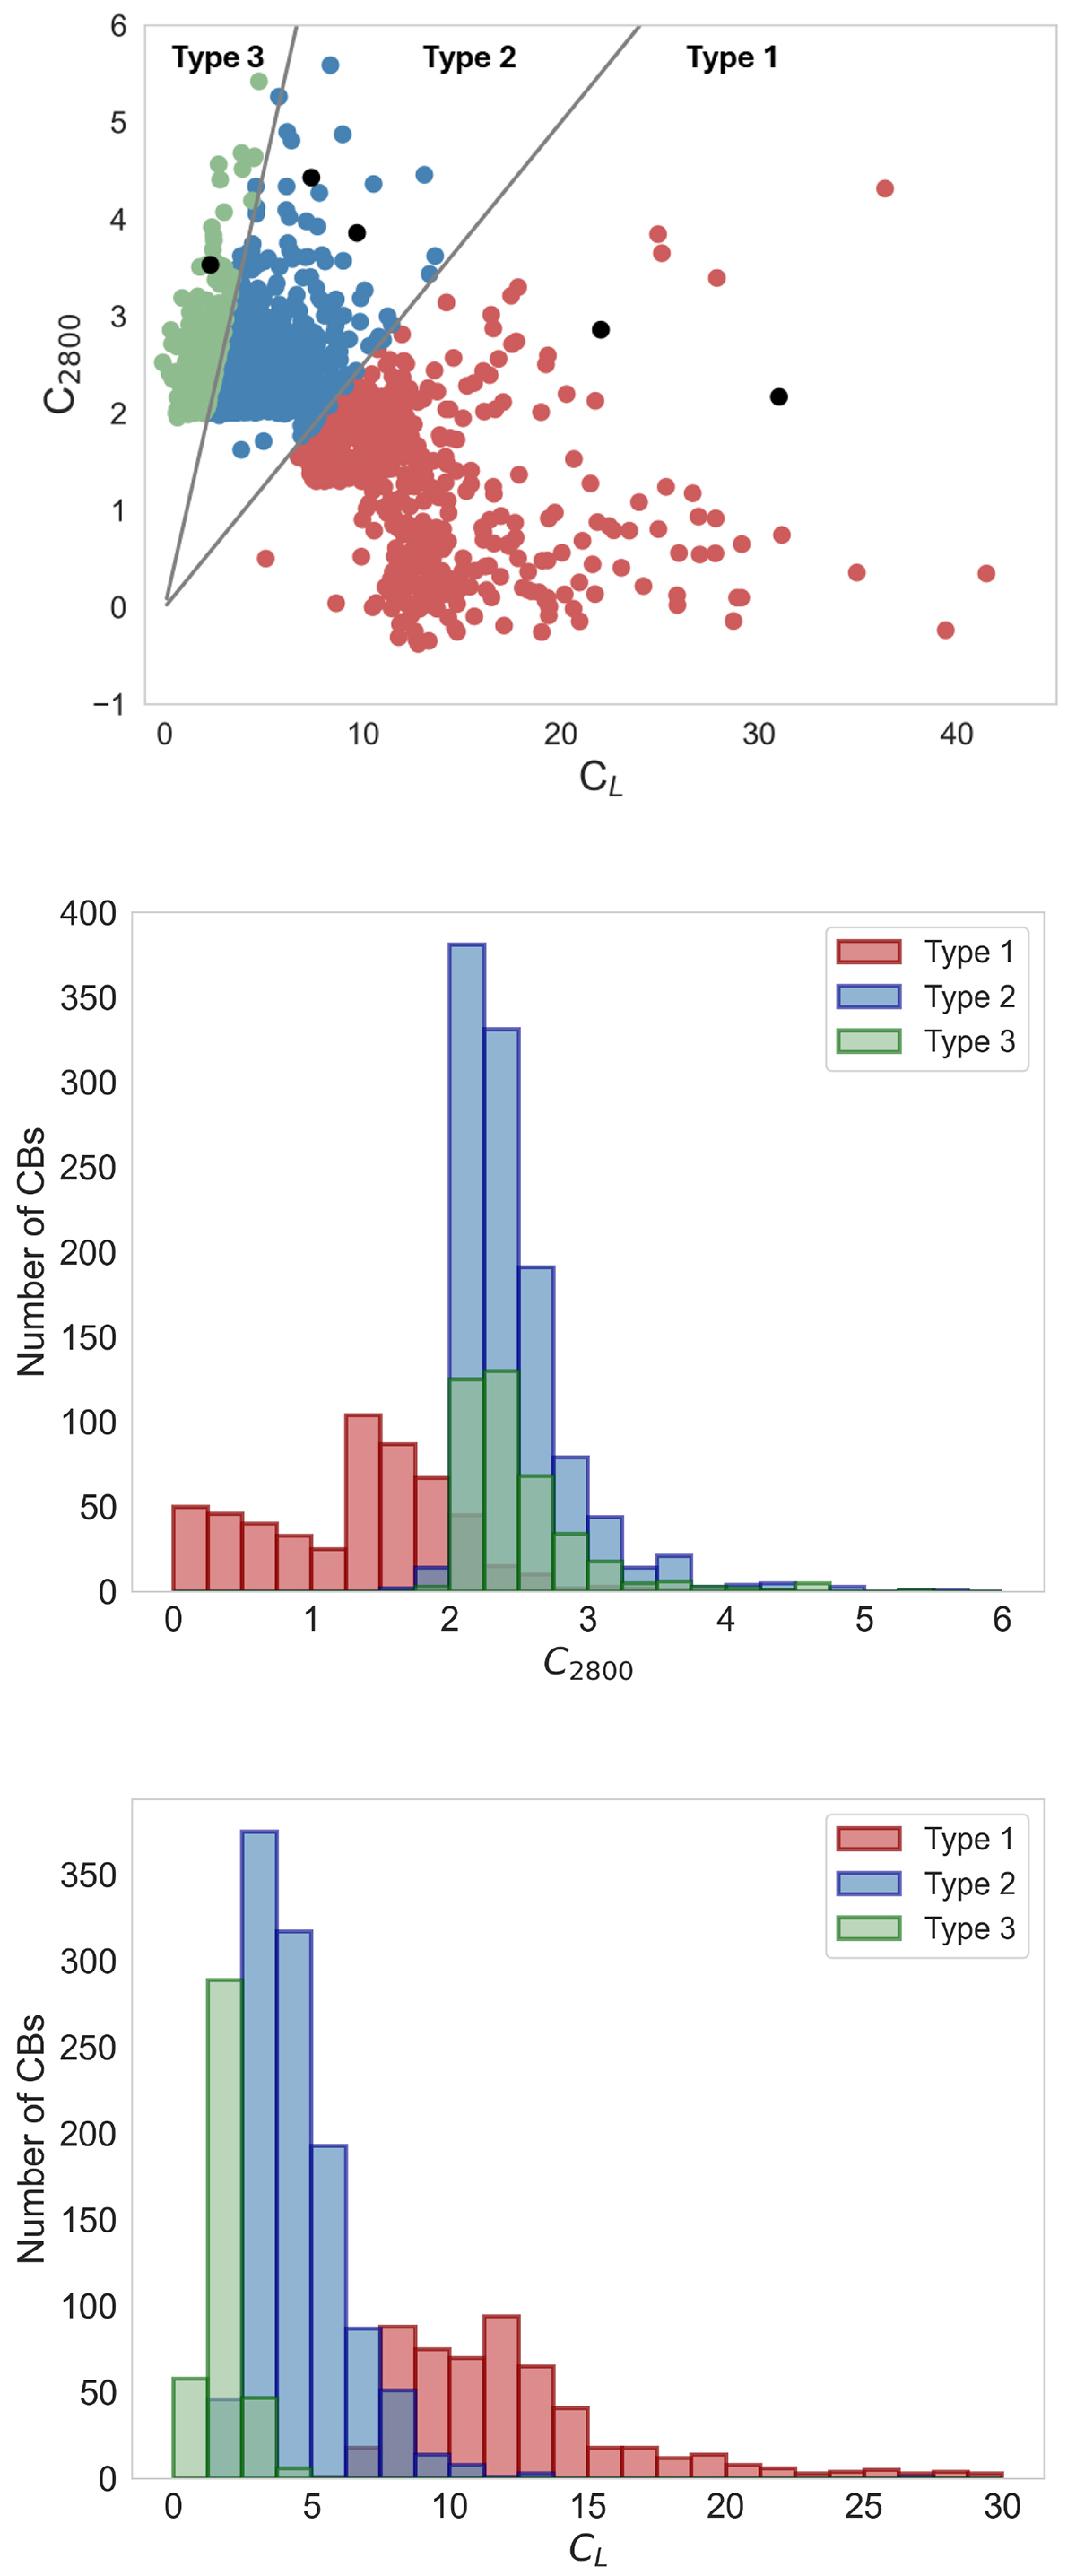
Download original image
Top panel: Correlation plot showing the relation between the contrast at 2800 Å (C2800) and the contrast in the mean contrast in the Mg II k line (CL). Middle panel: histograms of C2800. Bottom panel: Histogram of CL. Type 1 CB is in red color, Type 2 CB is in blue, Type 3 CB is in green. In the top panel we note a global anticorrelation with a general tendency that increasing line emission leads to decreasing wing emission. The diagonal gray lines indicate the values of the ratio, R (0.25 and 0.9), which separate the three types of CBs. Black dots indicate the five CBs from paper Grubecka Litwicka et al. (2016).
Current usage metrics show cumulative count of Article Views (full-text article views including HTML views, PDF and ePub downloads, according to the available data) and Abstracts Views on Vision4Press platform.
Data correspond to usage on the plateform after 2015. The current usage metrics is available 48-96 hours after online publication and is updated daily on week days.
Initial download of the metrics may take a while.