Fig. 7.
Download original image
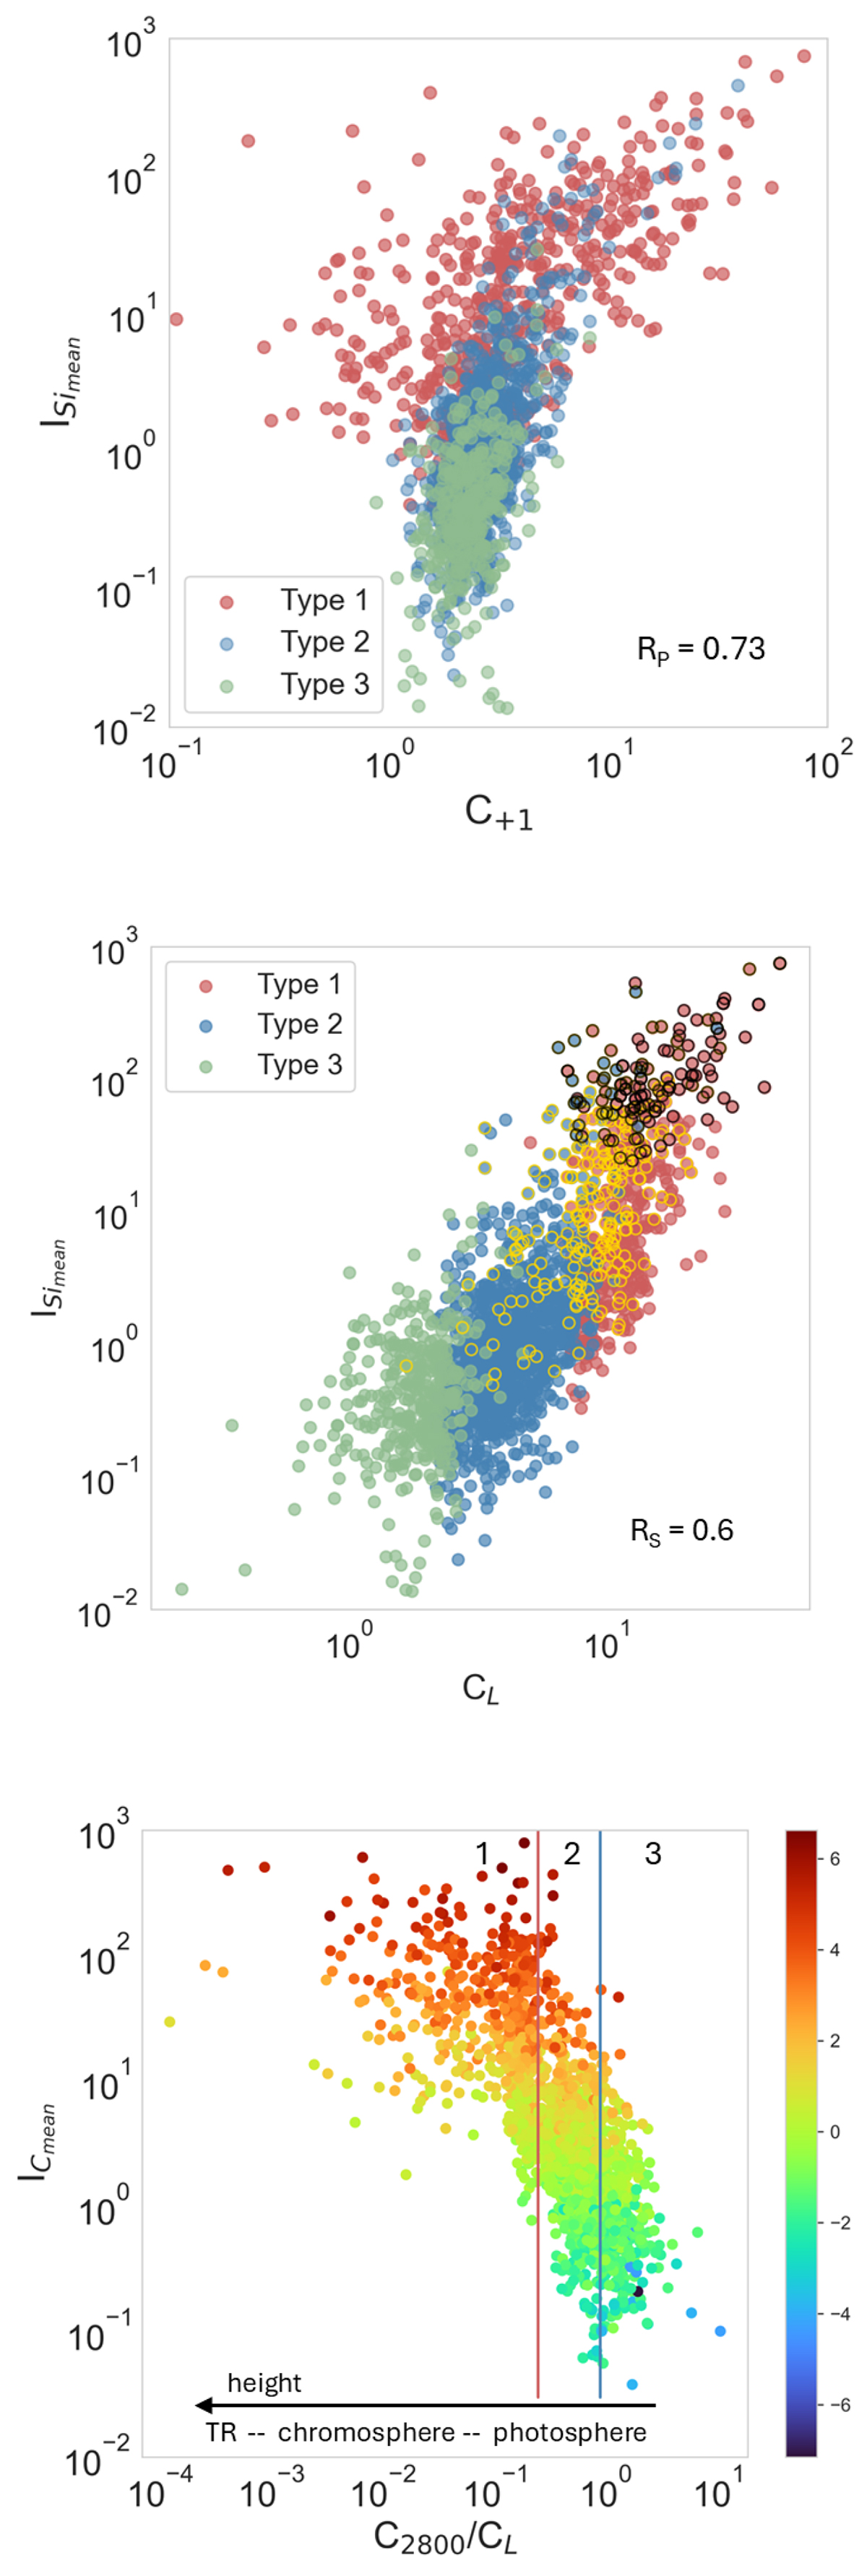
Upper panel: Correlation plot of C+1 and ISimean for three types of CBs. Middle panel: Correlation plot of CL and ISimean. With black circle edges, we mark CBs related to UV bursts, and with yellow possible EBs (more in Sect. 7). For the first two plots, colors of points refer to three types of CBs. Bottom panel: Correlation plot of ratio, R (C2800/CL, which relates to the atmosphere formation height (Fig. 4) and ICmean. Colors on this plot represent values of logarithm of the ISimean, according to color bar on the right side. Two vertical lines indicate the edges between three types of CBs (defined by C2800/CL), which are marked with the numbers “1,” “2,” and “3” at the top of the plot.
Current usage metrics show cumulative count of Article Views (full-text article views including HTML views, PDF and ePub downloads, according to the available data) and Abstracts Views on Vision4Press platform.
Data correspond to usage on the plateform after 2015. The current usage metrics is available 48-96 hours after online publication and is updated daily on week days.
Initial download of the metrics may take a while.