Open Access
Fig. 8.
Download original image
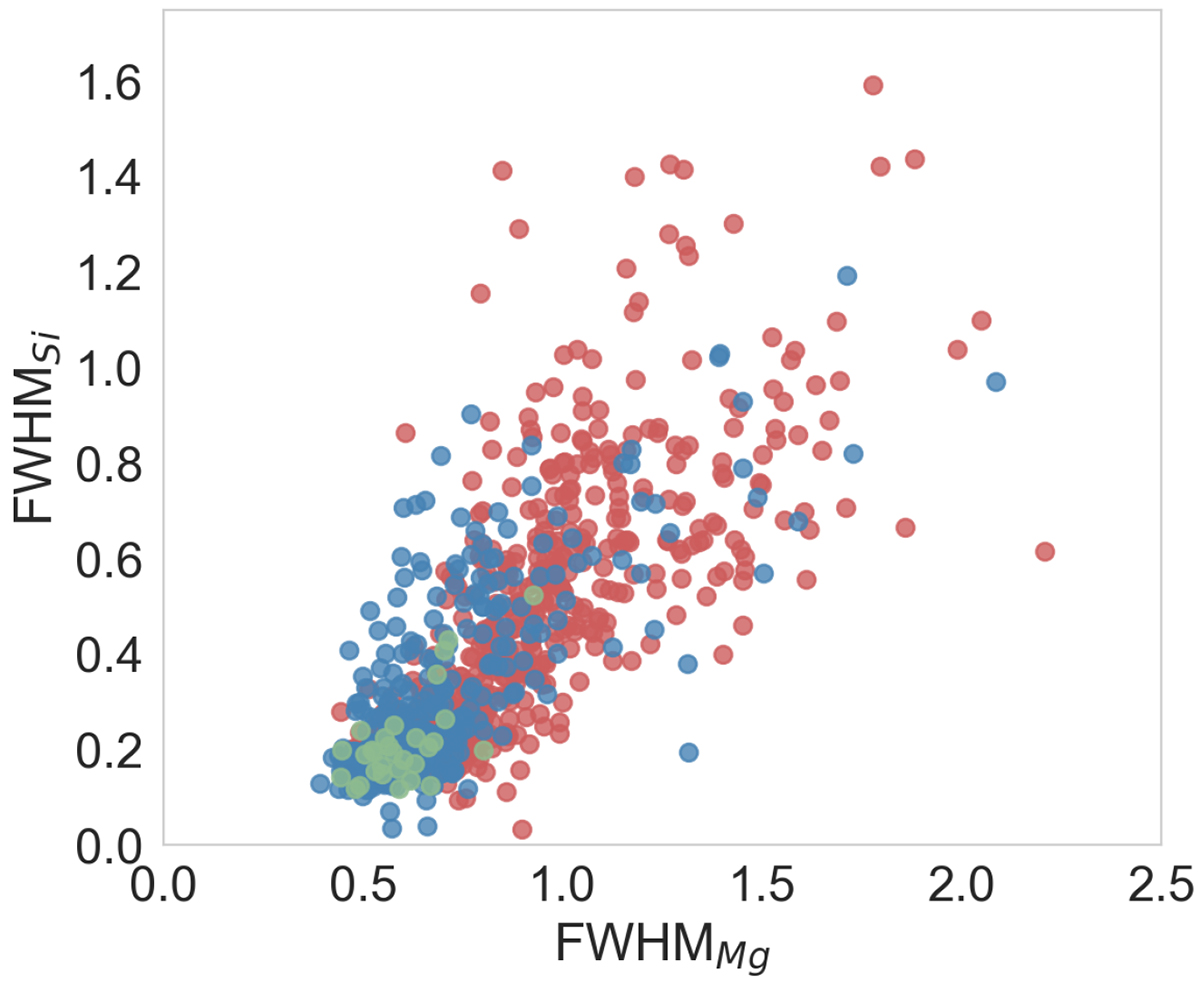
Correlation plot shows relations between FWHMMg and FWHMSi for all CBs with FUV emission greater than threshold values. The Pearson coefficient describing linear relations is equal to 0.78. The red color represents Type 1 CBs, blue Type 2, and green Type 3.
Current usage metrics show cumulative count of Article Views (full-text article views including HTML views, PDF and ePub downloads, according to the available data) and Abstracts Views on Vision4Press platform.
Data correspond to usage on the plateform after 2015. The current usage metrics is available 48-96 hours after online publication and is updated daily on week days.
Initial download of the metrics may take a while.