Fig. 12.
Download original image
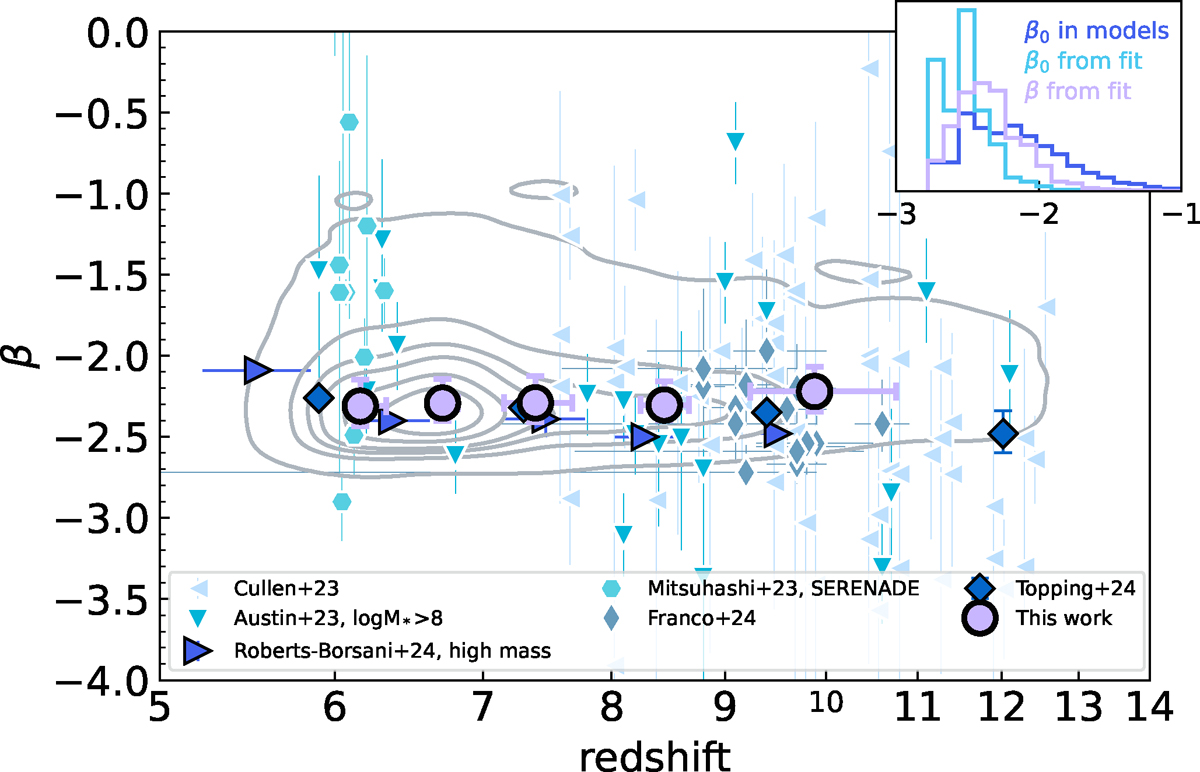
β as a function of redshift. Grey contours show the full JADES/A3COSMOS sample, while purple circles show the median position in several redshift bins. Different samples from the literature are shown in shades of blue (Laporte et al. 2017, 2019; Tamura et al. 2019; Inami et al. 2022; Mitsuhashi et al. 2024; Schouws et al. 2025; Topping et al. 2024). The inset panel shows the distribution of the intrinsic UV slope, β0, allowed by the models (dark blue), as well as β0 and β obtained from the SED fitting.
Current usage metrics show cumulative count of Article Views (full-text article views including HTML views, PDF and ePub downloads, according to the available data) and Abstracts Views on Vision4Press platform.
Data correspond to usage on the plateform after 2015. The current usage metrics is available 48-96 hours after online publication and is updated daily on week days.
Initial download of the metrics may take a while.