| Issue |
A&A
Volume 700, August 2025
|
|
|---|---|---|
| Article Number | A277 | |
| Number of page(s) | 13 | |
| Section | Extragalactic astronomy | |
| DOI | https://doi.org/10.1051/0004-6361/202453278 | |
| Published online | 28 August 2025 | |
Dust emission from the bulk of galaxies in the Epoch of Reionisation
1
Aix Marseille Univ, CNRS, CNES, LAM, Marseille, France
2
Argelander-Institut für Astronomie, Universität Bonn, Auf dem Hügel 71, 53121
Bonn, Germany
3
Université Paris-Saclay, Université Paris Cité, CEA, CNRS, AIM, 91191
Gif-sur-Yvette, France
4
Université Côte d’Azur, Observatoire de la Côte d’Azur, CNRS, Laboratoire Lagrange, 06000
Nice, France
5
Université de Strasbourg, CNRS, Observatoire astronomique de Strasbourg, UMR 7550, 67000
Strasbourg, France
6
Max Planck Institute for Astronomy, Königstuhl 17, 69117
Heidelberg, Germany
7
Max-Planck-Institut für Extraterrestische Physik (MPE), Giessenbachstr., 85748
Garching, Germany
8
Purple Mountain Observatory, Chinese Academy of Sciences, 10 Yuanhua Road, Nanjing, 210023
PR, China
⋆ Corresponding author: This email address is being protected from spambots. You need JavaScript enabled to view it.
Received:
3
December
2024
Accepted:
14
July
2025
Abstract
The excess of UV-bright galaxies observed at z > 10 has been one of the major surprises of the early JWST observations. Several explanations have been proposed to understand the mild change in space density of the UV-bright galaxies at these high redshifts, among them an evolution of dust attenuation properties in galaxies. However, our view of dust in primordial galaxies is limited towards a few tens of z ∼ 7 galaxies, pre-selected from UV-optical observations, and are thus not necessarily representative of the bulk of the sources at these redshifts. In this work, we aim to constrain the dust properties of galaxies at 6 < z < 12 by making the most of the A3COSMOS database in the JADES/GOODS-South field. We stacked ALMA band 6 and 7 observations of 4464 JADES galaxies covered by the A3COSMOS database and used the measurements as constraints to perform UV-to-FIR SED modelling. We obtained tentative signals for the brightest UV galaxies (MUV < −19 mag) as well as for the most massive ones (logM⋆/M⊙ > 9) at 6 < z < 7, and upper limits for fainter (MUV > −19 mag), lower-mass sources (logM⋆/M⊙ < 9), or ones at higher redshift (z > 7). Fitting these 6 < z < 7 galaxies with ALMA constraints results in lower star formation rates (−0.4 dex) and FUV attenuation (−0.5 mag) for galaxies with logM⋆/M⊙ > 8, compared to the fit without FIR. We extend the LIR vs MUV relation down to MUV = −19 mag and show a tentative breakdown of the relation at fainter UV magnitudes. The positions of the JADES z ∼ 6.5 sample on the infrared excess (IRX) versus β and IRX versus M⋆ diagrams are consistent with the ones of the ALPINE (z ∼ 5.5) and REBELS (z ∼ 6.5) samples, suggesting that the dust composition and content of our mass-selected sample are similar to the ones of these UV-selected galaxies. Extending our analysis of the infrared properties to z > 7 galaxies, we find a non-evolution of β in the MUV range probed by our sample (–17.24−0.62+0.54), and highlight the fact that samples from the literature are not representative of the bulk of galaxy populations at z > 6. We confirm a linear relation between AV and sSFR−1 with a flatter slope than previously reported due to the use of ALMA constraints. Our results suggest that rapid and significant dust production has already happened by z ∼ 7.
Key words: galaxies: evolution / galaxies: fundamental parameters / galaxies: high-redshift
© The Authors 2025
 Open Access article, published by EDP Sciences, under the terms of the Creative Commons Attribution License (https://creativecommons.org/licenses/by/4.0), which permits unrestricted use, distribution, and reproduction in any medium, provided the original work is properly cited.
This article is published in open access under the Subscribe to Open model. This email address is being protected from spambots. You need JavaScript enabled to view it. to support open access publication.
1. Introduction
In the interstellar medium (ISM) of galaxies, dust plays a crucial role, catalysing the transformation of atomic hydrogen into molecular hydrogen, the raw material for star formation (Wolfire et al. 1995). Dust also enables gas to cool and condense into new stars by absorbing ultraviolet (UV) radiation from nearby young stars (Draine 1978; Dwek 1986; Hollenbach & Tielens 1997). This absorbed energy is then re-emitted in the infrared (IR) range, where dust grain thermal emission dominates the spectral energy distribution (SED) of galaxies, covering wavelengths from approximately 8 to 1000 μm. Because of its important role in the ISM and its tight link with the other components of galaxies, the study of dust emission is paramount for a better understanding of all of the processes at play, especially galaxies’ star formation activity.
At z > 4, most of the constraints on star formation in galaxies are obtained via UV emission, which is highly sensitive to dust attenuation and needs to be corrected to obtain a complete view (e.g. Calzetti et al. 2000; Salim & Narayanan 2020). Understanding how dust attenuation varies with redshift and other galaxy properties is thus essential for accurately determining star formation rates (SFRs), and thereby constructing a precise account of galaxy evolution throughout cosmic history. At z > 4, two programmes targeted UV-selected galaxies to be observed with the Atacama Large Millimeter/Submillimeter Array (ALMA). ALPINE (ALMA Large Program to INvestigate CII at Early times; Le Fèvre et al. 2020; Béthermin et al. 2020; Faisst et al. 2020) provided 23 far-infrared continuum-detected galaxies at z ∼ 5. At a slightly higher redshift, the REBELS survey (Reionization Era Bright Emission Line Survey, Bouwens et al. 2022) provided dust continuum ALMA observations of 40 UV-selected bright galaxies at 6.5 < z < 7.7. At z > 7, a few galaxies have been detected in dust emission (e.g. Watson et al. 2015; Laporte et al. 2017, 2019; Bowler et al. 2018; Tamura et al. 2019; Bakx et al. 2020; Sugahara et al. 2021; Endsley et al. 2022; Witstok et al. 2022; Schouws et al. 2022; Algera et al. 2023), providing hints that significant dust reservoirs are already in place at early times. Although they provide an indispensable and detailed view of dust emission at z ≳ 4, these UV-selected samples are limited in terms of statistics and might only represent the tip of the infrared luminosity distribution at these redshifts. To overcome this, with a different approach, Magnelli et al. (2024) used the A3COSMOS ALMA database (Liu et al. 2019; Adscheid et al. 2024), gathering a wealth of ALMA archival observations to statistically probe dust properties of a mass selected sample at 4 < z < 5.
The infrared excess (IRX≡LIR/LUV) versus β relation is widely used as a dust attenuation diagnostic (Calzetti et al. 1994, 2000; Meurer et al. 1999). While this relation provides accurate estimates of the attenuation for local starburst galaxies (Meurer et al. 1999), the position of normal star-forming galaxies relative to it is still debated (e.g. Capak et al. 2015; Barisic et al. 2017; Hashimoto et al. 2019; Bakx et al. 2020; Bowler et al. 2022, 2024; Schouws et al. 2022; Boquien et al. 2022; Magnelli et al. 2024). The position of galaxies with respect to the IRX-β relation depends on the geometry of dust and stars in the galaxy (Popping et al. 2017; Narayanan et al. 2018; Ferrara et al. 2022; Pallottini et al. 2022; Vijayan et al. 2022) and an effect due to star formation history (SFH) is also expected, since the UV β slope is a combination of dust attenuation and the intrinsic UV slope, β0 (Boquien et al. 2012). Magnelli et al. (2024) used averaged measurements of ALMA galaxies using A3COSMOS to investigate the dust attenuation properties of star-forming galaxies at 4 < z < 5. They find that the average properties of their sample are compatible with the relations of Meurer et al. (1999) and Calzetti et al. (2000) for local starbursts. Similar conclusions were reached by Bowler et al. (2024) on stacked properties of the REBELS galaxies at z ∼ 7. Both results point towards non-evolving grain properties (e.g. size distribution, composition). However, using the ALPINE sample of galaxies at 4.4 < z < 5.5, Boquien et al. (2022) found a wider variety of attenuation curves among these sources from relations steeper than the Small Magellanic Cloud (SMC) extinction curve to relations shallower than for local starbursts. In their fitting process, the slope of the attenuation curve, δ, was let free, which could explain the larger variety of curves that they find.
The relation between IRX and the stellar mass is another diagnostic of the dust attenuation properties, with the IRX quantifying the dust obscured fraction, while the stellar mass is a proxy of the past star formation activity, and hence of dust production. Recently, there have been claims of a steepening of the relation between IRX and stellar mass with increasing redshift (Fudamoto et al. 2020; Magnelli et al. 2024); that is, a decreasing obscured fraction with redshift. This would imply an evolution of dust geometry relative to new-formed stars. Using the REBELS sample of galaxies at z ∼ 7, Bowler et al. (2024) also found a decrease in the obscured fraction with redshift but associated with a IRX-stellar mass relation with a relatively flat slope, in contradiction with the results of Fudamoto et al. (2020) and Magnelli et al. (2024), adding to the debate.
The goal of this work is to extend these studies in terms of statistics but also redshift with a statistical analysis using the A3COSMOS (A3GOODSS) archival data, pushing it to its limits by stacking galaxies at z = 6 and beyond, observed as part of the JADES survey (Rieke et al. 2023). Indeed, dust at higher redshifts (z ≳ 9 − 10) is also central in the discussion to understand the origin of the excess of UV-bright galaxies observed at z > 10 (e.g. Castellano et al. 2022; Naidu et al. 2022; Donnan et al. 2023; Harikane et al. 2024; Arrabal Haro et al. 2023; Curtis-Lake et al. 2023; Robertson et al. 2023; Roberts-Borsani et al. 2024). The evolution of attenuation properties is mentioned as a possible explanation to the abundance of such ‘blue monsters’ (e.g. Ferrara et al. 2023). Constraints on the infrared emission of early galaxies could provide benchmark properties for these studies.
The paper is organised as follows. In Sect. 2 we describe the JADES sample used as a prior for the ALMA stacking and in Sect. 2.2 the SED fitting procedure to obtain the UV magnitudes and stellar mass from which we bin them. The ALMA stacking of the sources using A3COSMOS is detailed in Sect. 3. We compare the properties of the galaxies using and not using the ALMA constraint in the SED modelling in Sect. 4 and study the dust properties of the sample in Sect. 5. Constraints on galaxies at z > 7 are provided in Sect. 6. Throughout the paper, we use a Salpeter (1955) initial mass function and WMAP7 cosmology (Komatsu et al. 2011).
2. The sample
2.1. Sample selection
We used the second release of the JWST Advanced Deep Extragalactic Survey (JADES, Rieke et al. 2023; Bunker et al. 2024; Eisenstein et al. 2023a; Hainline et al. 2024) of the Hubble Ultra Deep Field covering 68 sq.arcmin presented in Eisenstein et al. (2023b). Although the main part of the study focuses on galaxies with 6 < z < 7, we selected galaxies with 6 < z < 12 in the JADES catalogue. We refer to Rieke et al. (2023), Eisenstein et al. (2023b), and Robertson et al. (2024) for more details on the data reduction process, photometry procedures, and redshift estimates. This catalogue combines nine broad and five medium JWST/NIRCam bands from the JADES and JEMS (Williams et al. 2023) surveys, respectively, and existing HST imaging, for a total of 23 photometric bands. The reddest NIRCam filter, where the galaxies were selected (F444W), allows us to probe the 0.63 μm and 0.34 μm rest frame at z = 6 and z = 12, respectively. In this work we have used the photometry catalogue made from KRON apertures. In the broad NIRCam bands, the 5σ flux depths are between 1.9 and 3.0 nJy, while they range from 1.6 to 3.3 nJy in the medium bands. Photometric redshifts available in the JADES catalogue were computed with the code EAZY (Brammer et al. 2008). The average offset between photometric redshifts and a compilation of spectroscopic redshifts is 0.05 with a Δz/(1 + z) of 0.024. We used spectroscopic redshifts when available, although this concerns only 0.6% of the sample at 6 < z < 7, and 0% at z > 7. We also checked for spectroscopic data through the Dawn JWST Archive1 (Heintz et al. 2025) and found 37 NIRSpec spectra. Out of these, nine are galaxies with zspec < 5.5, which we excluded from our analysis.
As in Ciesla et al. (2024), we imposed that each galaxy should be detected with a signal-to-noise (S/N) higher than 3 in at least three JWST filters. This criterion results in a sub-sample of 8810 galaxies with redshifts between 6 and 12, 6000 of them between 6 and 7. Given the uncertainty on photometric redshift, several studies impose a criterion on the quality of the photometric redshift, based on its PDF (e.g. Cole et al. 2025; Finkelstein et al. 2023). However, in the following, we consider the full galaxy sample. Indeed, after redoing the analysis of this work imposing the same photo-z quality criteria as Cole et al. (2025), we find no strong impact on our results, a conclusion also reached by Cole et al. (2025).
A particular focus on the 6 < z < 7 bin is made in the paper, driven by the tentative signal obtained from stacking the ALMA observations that is more constraining at 6 < z < 7 than at higher redshifts. We extend our analysis at higher redshifts in Sect. 6.
2.2. SED modelling with CIGALE and physical properties
We used the SED modelling code CIGALE2 (Code Investigating GALaxy Emission, Boquien et al. 2019) on the HST+JWST set of data, probing the UV to NIR rest-frame wavelength range. The fitting set-up of CIGALE was the same as the one tested and used in Ciesla et al. (2024), which adopts a non-parametric SFH specifically tailored for early galaxies. The non-parametric approach usually assumes a prior to handle the relation between two consecutive SFR bins of the SFH (continuity, bursty continuity, etc.). In this work, we used the non-parametric SFH from Ciesla et al. (2024), who used no prior and showed that it provides more flexibility to model the bursty SFH expected in early galaxies. We note that this SFH library results in a wide range of β0, the intrinsic UV slope, ranging from –2.78 to 2.65 with a median value of –2.20. We used the stellar population models of Bruzual & Charlot (2003), and a Calzetti et al. (2000) dust attenuation law that is found to be suitable for galaxies at z > 6 (Bowler et al. 2022; Markov et al. 2025).
CIGALE assumes an energy balance: the energy absorbed in the UV-optical is re-emitted in the IR. Some studies have shown a spatial offset between the stellar (UV) and dust (IR) emission in some high-redshift sub-millimetre galaxies (e.g. Hodge et al. 2016; Elbaz et al. 2018) resulting in discussions on the validity of UV-to-IR SED modelling based on energy balance. Using the disturbed morphology of M 82 as a test-bed, Seillé et al. (2022) show that the estimates of the SFR and stellar mass for the whole galaxy are found to be consistent with the sum of the same parameters obtained for individual regions. The same conclusion is reached by Li et al. (2024) at 4 < z < 6 from a resolved analysis of ALMA-CRISTAL galaxies, suggesting that there is no bias due to outshining by young stars on the derived global properties of these sources. Furthermore, using FIRE zoom-in simulations of dusty and high-redshift galaxies, Haskell et al. (2023) demonstrate that when the quality of the fit is acceptable, the fidelity of SED modelling estimates using energy balance is independent from the degree of UV/FIR offset, with a similar quality as was previously reported for local galaxies. Therefore, we are confident in using the ALMA constraint and performed the SED modelling from UV to FIR using the energy balance.
To model the IR emission, we used the dust library of Schreiber et al. (2018), which has two free parameters. The first is the fraction of dust mass locked in the form of polycyclic aromatic hydrocarbons (PAHs), which can vary from 0 to 100%. The second is the dust temperature, which varies from 15 to 60 K. The data used in this work does not allow us to constrain the PAH fraction. Therefore we chose to fix this input parameter to 3%, which corresponds to the estimate of Schreiber et al. (2018) at z ∼ 3, the highest redshift constraint provided in their study. We note that Shivaei et al. (2024) found a constant value of 3.4% for the PAH fraction at metallicities of ∼0.5 Z⊙, which decreases to values lower than 1% at ∼0.3 Z⊙. However, due to the lack of observational constraints, the PAH fraction does not have a significant impact on the results and we kept a fixed value of 3%. Regarding the dust temperature, following the results of Sommovigo et al. (2022) from REBELS galaxies, we set it to 47 K. In Sect. 5.3 we test the impact of this dust temperature assumption on our results.
To estimate the physical properties, the models were fitted to the observations and the likelihoods were computed from the χ2. The galaxy properties were taken as the likelihood-weighted means and the uncertainties are the likelihood-weighted standard deviations. One important aspect to note is that upper limits were taken into account in the fitting procedure (see Sect. 4.3 of Boquien et al. 2019, for the presentation of the mathemical implementation). In this work, we take 3σ observational uncertainties as the upper limits.
The parameters used for the fit are provided in Table 1. In their analysis, Ciesla et al. (2024) show that the physical properties, such as stellar mass and SFR, of galaxies with 6 < z < 12 are well constrained with the HST+JWST set of filters of the JADES survey. As we are using the same combination of filters, we rely on their results. We first applied this CIGALE set-up to the JADES sample using only HST and JWST observations. The resulting normalised distributions of UV magnitude, stellar mass, SFR, and UV slope (β) are shown in Fig. 1 for the 6 < z < 7 galaxies. Our sample allows us to probe relatively faint UV magnitudes (–17.11 mag), a median stellar mass of
  , a median SFR of
  , and relatively blue UV β slopes (–2.24
 ). The sample that we use for the ALMA stacking was built from this HST+JWST CIGALE run. We selected galaxies with a reduced χ2 no larger than 4, removing 26 galaxies for which many sources have SEDs that are similar to brown dwarves’ SEDs. The second run of CIGALE using the ALMA constraints is presented in Sect. 4.
CIGALE input parameters used to fit the JADES sample.
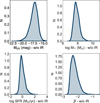 |
Fig. 1. Normalised distributions of the physical properties of the 6 < z < 7 JADES selected sample obtained from UV-to-NIR rest-frame SED modelling (without IR). From left to right, and top to bottom: UV magnitude, stellar mass, SFR, and UV slope, β. |
3. ALMA stacking of JADES galaxies
We used the A3GOODSS ALMA archival database, part of the A3COSMOS database (version 20220606; Liu et al. 2019; Adscheid et al. 2024), to perform a stacking analysis on our galaxy sample, choosing ALMA images from bands 6 (∼243 GHz) and 7 (∼324 GHz). Out of the 5974 galaxies in our 6 < z < 7 sample, 4464 are covered by one or multiple ALMA pointings (i.e. within an area of a primary beam attenuation > 0.5). Regarding astrometry, the most critical optical versus ALMA astrometric errors are < 0.2″(e.g. Franco et al. 2018). JWST astrometry are tied to Gaia and should therefore be better. As the ALMA observations we are using have a point spread function full width at half maximum greater than 0.2″, we do not consider astrometry to be a possible issue. This reduces our sample to 4464 galaxies, with redshift, stellar mass, UV luminosity, and UV spectral slope distributions that are indistinguishable (Kolmogorov-Smirnov test) from the ones of their parent sample of 5974 galaxies.
Because of this large number of galaxies, it was impractical to stack them in the uv domain in order to deal with the heterogeneity in angular resolution (ranging from ∼0.1′′ to ∼2′′) of these multiple ALMA pointings (see, e.g. Wang et al. 2022, 2024; Magnelli et al. 2024). To solve this problem, we instead used the fact that at ∼1 mm, galaxies are compact in size (∼0.1′′; e.g. Gómez-Guijarro et al. 2022) and can therefore be considered spatially unresolved at resolutions ≥0.2′′, so that Speak = Stotal. Therefore, we excluded images with synthesised beam sizes < 0.2′′ from our analysis and ‘stacked’ only primary beam-corrected flux densities measured from the central pixel at each source position. However, we checked that our results and conclusions are not affected by this cut-off when applying a larger one (< 0.4′′). The measured fluxes were re-normalised from their observed wavelength (within the ALMA bands 6 or 7) to a common 1.1 mm observed wavelength using the star-forming galaxy SED template of Béthermin et al. (2012). The final stacked flux density is the noise-weighted mean of all individual flux densities, Si:
with σi the pixel RMS noise at the position of each galaxy.
We first binned galaxies by UV magnitude in four bins: −22 < MUV < −20 mag, −20 < MUV < −19 mag, −19 < MUV < −18 mag, and −18 < MUV < −17 mag. Selecting galaxies with MUV < −17 mag yields a total of 2455 galaxies. We provide in Table 2 the resulting ALMA measurements for each bin as well as the corresponding number of galaxies and pointings.
Results of the ALMA stacking analysis at 6 < z < 7.
We show these measurements in the left panel of Fig. 2 along with the predicted ALMA fluxes obtained from UV-NIR only SED fitting. The ALMA flux of the brightest sources (MUV < −20 mag) is slightly overestimated in the absence of IR constraints although still compatible within the errors. At fainter magnitudes, the upper-limit predictions are in agreement with the ALMA measurements. We note that if we assume the ALMA fluxes predicted from the UV-NIR SED modelling, a S/N = 3 detection from the ALMA stacking would require approximately 10 660 and 52 000 sources, in the −19 < MUV < −18 mag and −18 < MUV < −17 mag bins, respectively, or deeper ALMA observations of the 629 and 1627 sources observed in these bins, respectively.
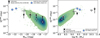 |
Fig. 2. Left panel: Flux densities obtained by stacking ALMA observations in four UV magnitude bins (black symbols). Circles with downward arrows are 3σ upper limits. The contours show the spread of predicted fluxes without the ALMA constraint. The grey circles with black borders are the median values of these predicted fluxes in each UV magnitude bin. The blue squares are the stack values of the REBELS sample (Bowler et al. 2024). Right panel: Same as left panel but using three stellar mass bins. The white circle is the expected flux density assuming a simple scaling to the stellar mass of the 9 < logM⋆ < 10 bin. |
We also stacked the ALMA observations of the JADES/A3COSMOS galaxies by bins of stellar mass (8 < logM⋆/M⊙ < 9, 9 < logM⋆/M⊙ < 10, and 10 < logM⋆/M⊙ < 11), and show the results in the right panel of Fig. 2. Selecting galaxies with logM⋆/M⊙ > 8 yields a total of 1415 galaxies. The predictions from UV-NIR SED fitting are consistent with the constraints obtained from the ALMA stacking. Despite being the most populated bin (1352 galaxies), the ALMA measurement of the lowest stellar mass bin (8 < logM⋆/M⊙ < 9) results in a 3σ upper limit of 2.5 μJy. More sources, by a factor of 5, would be needed according to SED modelling predictions to reach a S/N of 3 on this measurement. These galaxies being less massive, it is expected that they contain less dust than more massive galaxies. We cannot constrain the dust mass of the galaxies of our sample since we only have one ALMA data point probing the 137–157 μm rest-frame emission. To understand if this non-detection is compatible with the fact that lower-mass galaxies should have a lower dust content, we took the stellar mass as a proxy for galaxy SED normalisation and scaled down the ALMA flux density obtained from galaxies in the intermediate mass bin (9 < logM⋆/M⊙ < 10). We obtained a prediction of S1.1 mm of 3.2 μJy, which is in tension with our limit, suggesting that the dust content per unit of stellar mass of these low-mass systems is indeed lower than that observed in more massive objects.
4. Impact of the ALMA constraint on physical properties of 6 < z < 7 galaxies
In this section, we investigate the impact of the ALMA constraints on the inference of the physical properties of the JADES sub-sample. We ran CIGALE a second time using the ALMA stacking measurements as constraints for the IR part of the SED. We attributed to each galaxy the ALMA flux density obtained from stacking according to the derived UV magnitude of the first CIGALE run. For example, each galaxy with a UV magnitude within −22 < MUV < −20 was attributed a S1.1 mm of 5.4 ± 3.7 μJy.
In Fig. 3, we show an example of a z = 6.78 galaxy with MUV = −20.5 mag and logM⋆no − IR = 9.3. We show on the figure the resulting best fits with and without the ALMA constraint in red and blue, respectively. Clearly, without the ALMA constraint, the IR luminosity is over-predicted by the UV-NIR SED modelling, resulting in a significant AV of 1.1 mag. Using ALMA stacked measurements as a constraint, the AV decreases to 0.3 mag. This difference in AV results in a difference in age, with an older age obtained from the run using ALMA of 235 Myr compared to 105 Myr when ALMA is not used.
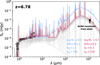 |
Fig. 3. Example of SED for a source at z = 6.78 in the 9 < log(M⋆no − IR/M⊙)< 10 stellar mass bin. The open black squares are the fluxes from HST and JWST and the blue line is the best fit model obtained fitting these data points. The filled black square indicates the ALMA measurement from stacks obtained in the same stellar mass bin, and the red line indicates the best fit model obtained when adding this IR constraint to the SED fitting. Parameters obtained from the two fits are indicated using the same colours. As an indication, the best SEDs obtained from the rest of the galaxies in the same stellar mass bin are shown in light grey. |
To understand the impact of the IR constraint on the derived physical properties of the galaxies of the whole sample, we compare in Fig. 4 the stellar masses, SFRs, FUV attenuations, and UV continuum β slopes obtained with and without the ALMA constraint.
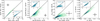 |
Fig. 4. Comparison between the physical properties obtained when fitting the UV-to-NIR rest-frame observations only (HST+JWST) and the ones obtained when adding the ALMA constraints. The solid black line is the one-to-one relationship. Results for the stellar mass, SFR, FUV attenuation, and β are shown from left to right. The black circles with error bars indicate the median error in each panel. The inset panels show the same figure for the most massive (logM⋆no − IR/M⊙ > 8) sources in the sample. |
The stellar mass is weakly affected by the addition of the ALMA constraints. However, for galaxies with 8 < log(M⋆no − IR/M⊙)< 10 the use of ALMA leads to slightly higher stellar masses, although it is well within the typical error on M⋆ which is 0.24 dex. Regarding the SFR, the estimates with and without IR measurements are on average in agreement although there are sources, the most massive ones (log(M⋆no − IR/M⊙)> 8, for which the SFR is clearly lower using IR measurements, with a median difference of –0.37 dex. For the FUV attenuation, the average trend shows a lower AFUV when ALMA is used but only by 5% on the average value, which is negligible compared to the typical errors on this measurement. However, as for the SFR, we find that for the most massive sources, AFUV is also lower when using IR constraints, with a median value of –0.49 mag. Finally, the UV slope, β, tends to be bluer when using ALMA constraints. The sources that deviate the most from the one-to-one relationship for each parameter are galaxies with log(M⋆no − IR/M⊙)> 8. For these sources, without IR constraints, the code is using stronger attenuation to fit the observations, while the fit with IR tends towards lower attenuation but older ages instead. This comparison suggests biases when estimating the physical properties of z > 6 galaxies without FIR constraints.
5. Dust attenuation properties
In this section, we study the dust attenuation properties of 6 < z < 7 galaxies, taking into account the ALMA constraint obtained from stacking. The physical properties of this sample are derived from their distribution (median, 25th, and 75th percentiles), using the same weights as were used to estimate the ALMA fluxes, and are provided in Table 3. For bins containing both galaxies with high S/N values and galaxies with upper limits on these physical properties, we derived upper limits of the median value using a parametric approach; that is, by fitting a normal distribution to the data and determining the z score at a 84% confidence level. The upper limit of the bin waws then derived by adding to the mean of the distribution the z score times the standard deviation of the distribution.
Stacked physical properties at 6 < z < 7 derived from the SED modelling using the ALMA constraint.
Several pre-JWST and JWST studies have reported a relation between the UV β slope and UV magnitude such as UV slopes shift towards bluer β at low UV luminosities (e.g. Finkelstein et al. 2012; Bouwens et al. 2014; Bhatawdekar & Conselice 2021; Topping et al. 2024). Although still debated at z > 8, this relation would indicate a trend between dust attenuation, which is the dominant component affecting the UV slope, and UV luminosity that may hint at a relationship between luminosity and metals in early galaxies (Cullen et al. 2023; Topping et al. 2024). In Fig. 5, we compare the UV properties (β and MUV) of our sample with sources from the literature at the same redshift.
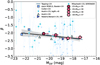 |
Fig. 5. β as a function of UV magnitude. Big circles with black edges are weighted medians in four UV magnitude bins. Samples from the literature are indicated by symbols with different shades of blue (Bowler et al. 2024; Cullen et al. 2023; Austin et al. 2023; Roberts-Borsani et al. 2024; Mitsuhashi et al. 2024), white edges showing individual galaxies and black edges stacked or median values. The relation from Topping et al. (2024) is shown with the solid line. |
Combining our measurement and the stack estimates from REBELS (Bowler et al. 2024; Austin et al. 2024; Roberts-Borsani et al. 2024), we obtain the following relation from a linear regression fit:
 (1)
(1)
The resulting slope is in agreement with the relations from Topping et al. (2024), who found a dβ/dMUV slope of −0.11 ± 0.02 and −0.12 ± 0.02 at z ∼ 5.9 and z ∼ 7.3, respectively, as well as the slopes obtained at z ∼ 5 by Rogers et al. (2014) and Bouwens et al. (2014) within errors (–0.12 ± 0.02 and –0.14 ± 0.02, respectively).
The ALMA stacking provides a constraint on the IR luminosity of the galaxies in our sample. In Fig. 6, we show the LIR as a function of the UV magnitude. The JADES sample combined with A3COSMOS observations allows us to probe fainter magnitudes and extend the LIR versus MUV relation down to MUV ∼ −17 mag. Our sample has logLIR/L⊙ spanning from 7.4 to 12.3 with a median value of 9.3. For comparison, we added the stacked measurements of the REBELS sample as well as the ones from the ALPINE sample at z ∼ 5.5 from Khusanova et al. (2021). Both these samples probe higher UV magnitude ranges and higher IR luminosities. A fit to the REBELS+ALPINE stacked signals combined with our two highest UV magnitude bins yields the following relation:
 (2)
(2)
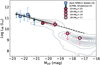 |
Fig. 6. Infrared luminosity as a function of UV magnitude. The contours show the position of the whole sample with LIR obtained from the fit using the ALMA constraint. Big circles with black borders are the weighted median values in four UV magnitude bins. Stacked or median values for samples from the literature are shown in various shades of blue symbols (Bowler et al. 2024; Khusanova et al. 2021). |
Extended to fainter UV magnitude, this relation predicts higher LIR at MUV > −19 than our estimates using ALMA. At MUV = −18.4 mag and –17.4 mag, the relation derived from higher UV magnitudes overestimates the LIR by 0.45 dex and 0.56 dex, respectively. This is a possible hint at a breakdown in the LIR versus MUV relation at low UV magnitudes that could be due to lower dust content. For the two UV-faintest bins, which have a median MUV of –18.4 and –17,4, the average stellar mass is logM⋆/M⊙ = 8.2 and 8.0, respectively. These two UV bins also have low dust attenuation: 0.31 and 0.33, respectively. Therefore, these low UV magnitudes are dominated by low-mass, low-attenuation systems, leading to a turnover of LIR, which has already been observed at lower redshifts (z ∼ 4) by Bernhard et al. (2014).
5.1. IRX versus β
We place our measurements, obtained from ALMA stacking in UV magnitude bins, on the IRX-β diagram in Fig. 7. Our averaged data points are close to the stacked measurements from REBELS, especially the brightest UV magnitude bin (−22 < MUV < −20), which corresponds to the UV magnitude range probed by the REBELS galaxies. They disfavour the expected relation from a SMC extinction curve but are compatible with a Calzetti et al. (2000) relations used in Bowler et al. (2024) with β0 = −2.3. Although our SFH library has a wide range of β0, galaxies of our sample favour blue β0 with a median value of –2.5, which is consistent with the assumed β0 of Reddy et al. (2018). Therefore, including the effect of dust, our sample has relatively blue β with a median value of –2.25.
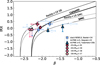 |
Fig. 7. IRX as a function of β. Coloured circles with black borders are weighted medians derived in four UV magnitude bins from our sample. The blue squares are the stacked values of Bowler et al. (2024) for the REBELS sample. The light blue downward triangles are the ALPINE z > 5 from Boquien et al. (2022), while the dark blue triangles are ALPINE stacks at z > 5 values from Fudamoto et al. (2020). The solid thick black line is the relation assuming a Calzetti et al. (2000) attenuation law, while the dotted line is the one assuming a SMC-like extinction curve. The thin black lines are the corresponding relations from Reddy et al. (2018). |
The galaxies in our sample are also compatible with both the starburst and SMC relations of Reddy et al. (2018), who used them with a different β0 than Bowler et al. (2024) (β0 = −2.6). These relations were found by Boquien et al. (2022) to be suitable for the ALPINE sample. In our process, we tested letting the δ slope of the attenuation curve free, as in Boquien et al. (2022). However, the improvement of the fit, using a ΔBIC (Bayesian information criterion) analysis, proved to be statistically significant for only 3.7% of the sample. Therefore, we kept δ fixed to 0 (no modification of the attenuation curve). Although they seem to favour the Reddy et al. (2018) relations, most estimates at low IRX were obtained from the ALMA upper limits on the IR and are thus upper limits on the IRX, as is indicated by the two faintest UV magnitude bins. However, at higher IRX, our estimates are compatible with the relations of both Calzetti et al. (2000) with β0 = −2.3 and Reddy et al. (2018) (starbursts and SMC, using β0 = −2.6). These findings are consistent with the results that grain size and dust composition at very high redshift are similar to local starbursts and SMC, indicating no fundamental evolution. Our results confirm that at z > 6, there is no clear sign of a breakdown of the Calzetti et al. (2000) relation.
5.2. IRX versus stellar mass
We place our galaxies on the IRX-M⋆ plane in Fig. 8. Specifically in this figure, we use the results of the SED fitting using the ALMA constraints obtained from stacking in bins of stellar mass (8 < logM⋆/M⊙ < 9, 9 < logM⋆/M⊙ < 10, and 10 < logM⋆/M⊙ < 11). Along with our data points, we add the relations from Pannella et al. (2015) at z ∼ 1 − 3, Magnelli et al. (2024) at 4 < z < 5, Fudamoto et al. (2020) at z ∼ 5.5, and Bowler et al. (2024) at z ∼ 7 (see also Álvarez-Márquez et al. 2019; Koprowski et al. 2018; Heinis et al. 2014; Bouwens et al. 2016).
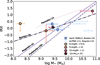 |
Fig. 8. IRX as a function of stellar mass. Circles with black edges are weighted medians colour-coded according to the stellar mass bin used for stacking. The red star is the position of the −22 < MUV < −20 bin for direct comparison with the stacked values of Bowler et al. (2024) for the REBELS sample (blue squares). The light blue downward triangles are the ALPINE z > 5 stacks values from Boquien et al. (2022). The solid light purple line is the relation from Magnelli et al. (2024), the dashed line is from Fudamoto et al. (2020), the dash-dotted line is the relation from Bowler et al. (2024), and the dotted light purple line the relation from Pannella et al. (2015) at lower redshifts. The darker the color of these relations, the higher the redshifts of the galaxies used to derive them. |
Our low-mass bin upper limit on IRX does not provide any useful constraint on the position of these galaxies on the IRX-M⋆ plane. The intermediate-mass median value is compatible with the relations of Bowler et al. (2024) and Magnelli et al. (2024), and marginally with the relation of Fudamoto et al. (2020). There seems to be a better agreement with the relation of Bowler et al. (2024), despite the large scatter indicated by the error bars (25th and 75th percentile). The high-mass bin data point is in agreement with the relations of both Magnelli et al. (2024) and Fudamoto et al. (2020), and marginally with the Bowler et al. (2024) relation, but here again the large scatter prevents us from discriminating a relation. For comparison, we show the brightest UV magnitude bin, −22 < MUV < −20 (red star), for consistency with the REBELS sample and find that it falls on the relation from Bowler et al. (2024), and is thus in agreement with their result. Finally, we show the relation obtained by Pannella et al. (2015) at lower redshift (z < 4), indicating that there is a clear decrease in IRX at fixed stellar mass with increasing redshift.
5.3. Impact of dust temperature assumption
At 6 < z < 7, ALMA 1.1 mm probes the 137–157 μm rest frame, which provides a good constraint on the peak of the IR SED. However, with only one flux measurement in the IR, the LIR strongly depends on the assumption made about the IR SED shape. In the dust emission model of Schreiber et al. (2018), this shape is handled through two free parameters: the PAH fraction and the dust temperature. The PAH fraction has little effect on the LIR, but the dust temperature, which we originally fixed at 47 K Sommovigo et al. (2022), is a key assumption that we can test in this section. Indeed, given the large masses and more evolved ISM properties found for REBELS galaxies (e.g. Algera et al. 2024; Rowland et al. 2025), dust temperature of REBELS galaxies are not necessarily appropriate for the broader JADES sample that contains lower-mass and metal-poor galaxies. Indeed, observations suggest that such galaxies could have higher dust temperatures, as high as 80 K (e.g. Laporte et al. 2017; Bakx et al. 2020). (Algera et al. 2024) also suggest that the low dust temperatures in REBELS galaxies could result from inefficient heating in a massive, dust-rich ISM with less bursty star formation, a scenario that may not apply to the lower-mass JADES galaxies.
We thus ran CIGALE several times, each time fixing the dust temperature to a different value. We varied Tdust from the highest value allowed by Schreiber et al. (2018) library, 60 K, down to a minimum value of 30 K, which corresponds to the lowest temperature of REBELS galaxies found by Sommovigo et al. (2022) (REBELS32, 39 K minus the lower error of 9 K). We note that Mitsuhashi et al. (2024) found temperatures as low as 26 K in the SERENADE sample, which is typical of the dust temperature at z < 1 (e.g. Schreiber et al. 2018), and recently Algera et al. (2024) obtained a dust temperature of 32
 K for REBELS25, a galaxy at redshift 7.31. Our lowest assumed temperature of 30 K is thus also consistent with the temperatures derived from the SERENADE sample and REBELS25.
We looked at the distribution of LIR using either the UV magnitude bins for the ALMA stacking (Fig. 9) or stellar mass bins (Fig. 10). We show the results of the SED modelling run for each dust temperature assumption (30, 33, 36, 39, 42, 45, 47, and 60 K). As was expected, the effect of decreasing dust temperature assumption is to shift the LIR distributions towards lower values. However, temperatures of ∼36–47 K result in similar LIR. For galaxies with logM⋆ < 9 and MUV < −19, assuming a temperature of 60 K pushes the estimate of the LIR to high values (logLIR = 11.). Despite these uncertainties on the IR SED, the distributions shown in Figs. 9 and 10 provide average constraints on the range of LIR of the bulk of galaxies at 6 < z < 7.
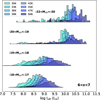 |
Fig. 9. LIR distributions of galaxies in the four UV magnitude bins considered in this work, assuming different dust temperatures. |
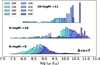 |
Fig. 10. LIR distributions of galaxies in the three stellar mass bins considered in this work, assuming different dust temperatures. |
The impact of Tdust on the different physical properties studied in Sect. 5 is presented in Fig. 11. This figure shows on the left panel the IRX-M⋆ plane using ALMA observations stacked in stellar mass bins, assuming the same set of dust temperatures than in Fig. 9. As was expected, the IRX parameter is affected. Very small variations are also found in M⋆ due to the fact that CIGALE performs SED modelling using an energy balance over the whole wavelength range, another indication of the error on the measurement that we can have on this parameter. The intermediate-mass bin galaxies are still compatible with the Bowler et al. (2024) relation as long as the temperature is lower than 47 K. A high dust temperature would bring the observations closer to the Pannella et al. (2015) relation at lower redshifts. A strong effect is, however, observed for the most massive bin, but this bin contains only four galaxies and is thus more subject to statistical variations.
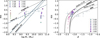 |
Fig. 11. Left panel: IRX as a function of stellar mass (symbols and lines following Fig. 8, except the upper limits that are shown here with coloured downward triangles). Filled coloured circles are the stacked measurements obtained for each temperature assumption. Right panel: IRX-β diagram (symbols and lines following Fig. 7). Galaxies are colour-coded as in the left panel. |
In the right panel of Fig. 11, we show the impact of the dust temperature assumption on the IRX-β diagram. The conclusions of Sect. 5 are still valid. Our data points are compatible with a Calzetti et al. (2000) relation using β0 = −2.3 or the Reddy et al. (2018) relation for starbursts (SB) and the SMC with β0 = −2.6. However, for high temperatures, the observations would prefer the SB relation of Reddy et al. (2018).
6. Infrared constraints at z > 7
We applied the ALMA stacking analysis described in Sect. 3 to JADES galaxies at z > 7 . The measurements result only in upper limits; however, they provide first constraints on the IR emission of the bulk of the population at these redshifts. We provide these upper limits in Table 4 in UV magnitude and stellar mass bins. We then perform the same SED modelling procedure on the z > 7 sources as for the 6 < z < 7 redshift bin, assuming the same dust temperature of Tdust=47 K.
Results of the ALMA stacking analysis at 7 < z < 9 and 9 < z < 12.
6.1. Evolution of β
We examine β as a function of redshift in Fig. 12. Although the galaxies in our sample are slightly redder than the averaged measurements of Roberts-Borsani et al. (2024) at the same redshifts, they do not show extreme values and lie within the range spanned by individual galaxies in the literature. As is discussed in Franco et al. (2024) (see also Topping et al. 2024), there is a caveat in using SED modelling to measure β as models are limited to a given β value towards the blue side of the distribution. In our case this value is defined by the lowest intrinsic value allowed by our model: β0 = −2.77. On the other hand, despite being more flexible, a direct measurement of β from the data can also introduce systematics due to the different rest-frame wavelength range used to measure β.
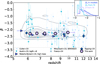 |
Fig. 12. β as a function of redshift. Grey contours show the full JADES/A3COSMOS sample, while purple circles show the median position in several redshift bins. Different samples from the literature are shown in shades of blue (Laporte et al. 2017, 2019; Tamura et al. 2019; Inami et al. 2022; Mitsuhashi et al. 2024; Schouws et al. 2025; Topping et al. 2024). The inset panel shows the distribution of the intrinsic UV slope, β0, allowed by the models (dark blue), as well as β0 and β obtained from the SED fitting. |
To understand the extent to which our results could be affected by the lower limit on β0 induced by SED modelling, we show in the inset panel of Fig. 12 the distributions of β0 allowed by our models (dark blue), β0 obtained from the SED fitting run (cyan), and the β for our galaxies (purple). For the total sample, the three redshift bins, only 15% of the galaxies select the lowest possible value of β0. A Kolmogorov-Smirnov test indicates that these galaxies have similar redshift and AFUV distributions to the total sample, but different M⋆ and age distributions, resulting in lower values for both properties. The fact that galaxies with the lowest β0 are not at a particular redshift means that these galaxies would not necessarily drive a trend that we would be missing between β and redshift. Furthermore, although we would expect to miss galaxies with the bluest β in the highest redshift bin from the expected trend, only 5% of these z = 9 − 12 galaxies have the lowest β0 value compared to 18 and 13% at z = 6 − 7 and z = 7 − 9, respectively. Therefore, despite the fact that we may miss a fraction of galaxies with extreme blue colours, our results seem to favour a relatively flat relation between β and redshift.
The β distribution of our sample points to the absence of a trend between β and redshift. A trend would be expected with galaxies having bluer colours with increasing redshift, since they become progressively metal- and dust-poor (e.g. Topping et al. 2024; Cullen et al. 2023). Recently, Cullen et al. (2023) found extremely blue galaxies at z ∼ 12 with a median β of –2.5, while Topping et al. (2024) obtained a median β of –2.48 for a sample drawn from JADES. At the same redshift, we find a median value of –2.14 ± 0.21, which is slightly redder. Although both the studies of Cullen et al. (2023) and Topping et al. (2024) found a decrease in β with increasing redshift, the latter mention that the rate of this evolution is slowest at low UV luminosities with minor differences between galaxies with MUV = −18 at z = 5 − 9 and z > 9. The bulk of galaxies in our sample are UV-faint (see Fig. 6) and the absence of strong evolution that we observe for the whole sample is consistent with the finding from Topping et al. (2024). Interestingly, we note that β is slightly redder in the highest redshift bin (z > 9.5), possibly confirming the results of Saxena et al. (2024) who found such a red β using a spectroscopic sample at the same redshift. They interpret this redder value as resulting from a rapid build-up of dust content in the very early Universe or a significant contribution from the nebular continuum emission to the observed UV spectra, depending on gas temperatures and densities.
We now try to put constraints on the evolution of LIR with redshift. At these high redshifts, the temperature of the cosmic microwave background (CMB) increases rapidly, reaching 19 K, 22 K, 27 K, and 30 K at z = 6, 7, 9, and 10, respectively (da Cunha et al. 2013). If not taken into account in the SED fitting procedure, the impact of the CMB results in an under-estimation of the LIR that depends on the dust temperature and redshift. da Cunha et al. (2013) demonstrated that for Tdust = 40 K the LIR is under-estimated by –0.018, –0.019, –0.045, and –0.070 dex at z = 6, 7, 9, and 10, respectively. We thus corrected our LIR measurement accordingly in Fig. 13, where we show them as a function of redshift. We note that at 6 < z < 7 the correction is negligible and was not taken into account in Fig. 6. For comparison, we added to Fig. 13 individual measurements from the literature: the REBELS sample (Inami et al. 2022), the SERENADE sample (Mitsuhashi et al. 2024), and the individual sources of Laporte et al. (2017, 2019), Tamura et al. (2019), and Schouws et al. (2025). Fig. 13 highlights the fact that the bulk of the population is still out of reach and that the samples on which models are basing their assumptions have extreme IR properties.
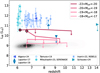 |
Fig. 13. IR luminosity as a function of redshift for our sample (black contours, downward arrows indicate upper limits) and different samples from the literature (shades of blue, Laporte et al. 2017, 2019; Tamura et al. 2019; Inami et al. 2022; Mitsuhashi et al. 2024; Schouws et al. 2025). Symbols with downward arrows are upper limits. Circles with black borders are our fiducial UV magnitude bins. |
6.2. Dust formation in early galaxies
Combining V-band attenuation and sSFRs measured from JWST/NIRSpec spectra of 631 galaxies at 3 < z < 14, Langeroodi et al. (2024) found that dust must have appeared rapidly and that attenuation follows star formation on timescales shorter than ∼30 Myr, favouring the scenario in which dust is produced by supernovae (SNe). They found a linear correlation between AV and the inverse sSFR (sSFR−1, a proxy for the age of the galaxies) for galaxies with redshifts from 3 to 14, and β from –3 to 0. Through a model, they show that the slope of this relation, γ, depends on several dust properties such as the efficiency of SN in producing dust, the fraction of dust destroyed by SN reverse and forward shocks, the fraction of dust removed from galaxy by feedback-driven outflows, dust geometry, and dust grain properties. They obtained γ = 0.67 ± 0.2 cm2 g−1, 30 times lower than the value expected if the entire SN dust yield were preserved in the ISM and had Milky-Way-like grain properties. Here, we use our photometry-based estimates of AV, M⋆, and SFR to compare the results obtained with the two different methods.
In Fig. 14, we show the V-band attenuation as a function of the inverse sSFR for the whole sample (6 < z < 12) binned by the UV slope, β, similarly to Langeroodi et al. (2024). Consistently with the results of the previous sections, we confirm a rapid dust production in early galaxies with non-negligible dust attenuation at sSFR−1 > 30 Myr. Despite using different methods (spectroscopy vs photometry-based SED modelling), our data points also confirm the linear relation between AV and sSFR−1 found by Langeroodi et al. (2024), implying that dust production is driven by star formation activity and stellar mass build-up.
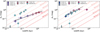 |
Fig. 14. Left: AV attenuation as a function of sSFR−1. Galaxies with 6 < z < 12 are binned with the UV β slope (circles). The solid black line is the linear fit of these binned points. Predictions of the linear AV-sSFR−1 relation at a fixed SFR surface density from Langeroodi et al. (2024) are indicated with dashed coloured lines. The stacked points obtained by Langeroodi et al. (2024) are shown as cyan hexagons. Right: Same as in the left panel but using the AV and sSFR−1 obtained with the UV-NIR SED fit; that is, without ALMA constraints. |
However, the intercept and slope of the relation obtained by our sample are lower and flatter, respectively:
 (3)
(3)
First we checked if the flatter slope that we observe is due to the SED modelling by performing a mock analysis (e.g. Buat et al. 2015; Ciesla et al. 2017; Boquien et al. 2019). Basically, we ran CIGALE once on the JADES galaxies. We took the best fit SED, convolved it in the JADES+ALMA set of filters, and added noise to the photometry. We again ran CIGALE on the mock photometry. In this way we can compare estimated parameters to the true ones used to build the mock photometry. From this test, we find that sSFR−1 is recovered within the error bars with a systematic overestimate (60%) and that AV is systematically underestimated by –0.4 mag. However, applying corrections derived from this mock analysis does not yield a slope consistent with the observations from Langeroodi et al. (2024) (0.58 ± 0.12). Although we looked at the impact of dust temperature assumption in Sect. 5.3 and concluded that it does not affect strongly our conclusions for the 6 < z < 7 redshift bin, studies predict that dust temperature keeps increasing with redshift (e.g. Sommovigo et al. 2022; Mitsuhashi et al. 2024). The temperature of 47 K that we assumed in this work is consistent with the results and predictions of Sommovigo et al. (2022) and Mitsuhashi et al. (2024). However, it can reach up to 60–65 K at z > 7. We thus tested the impact of increasing the assumption on Tdust for galaxies in the 9 < z < 12 to 60 K (the maximum value available in Schreiber et al. (2018) library) and looked at the impact of it on the slope of the AV-sSFR−1 relation. We obtain a slope of 0.63 ± 0.05 and conclude that the assumption on Tdust is not causing the difference observed between our study and the results of Langeroodi et al. (2024).
We then tested if the use of ALMA constraints is causing the discrepancy. Indeed, the third panel Fig. 4 shows that AFUV is lower when ALMA information is used in the SED modelling. However, using AV, M⋆, and SFR obtained from the UV-to-NIR SED modelling run (Fig. 4, right panel), our binned points are in perfect agreement with Langeroodi et al. (2024). We obtain a slope of 0.91 ± 0.17 if we discard the reddest β bin, which seems to be discrepant and has much lower statistics than the other bins. Therefore, we conclude that the addition of ALMA constraints is at the origin of the different slopes between the spectroscopic sample of Langeroodi et al. (2024) and our photometric one. Our flatter slope increases even more the discrepancy with γ obtained in Milky-Way conditions, but also points to a relation between sSFR−1 and the SFR surface density (ΣSFR ) for which we do not have access for our sample.
7. Conclusions
To place constraints on dust emission in galaxies in the Epoch of Reionisation, we have used the A3COSMOS (A3GOODSS) database to stack all JADES galaxies at 6 < z < 12 with available ALMA coverage in bands 6 and 7. Focusing on the 6 < z < 7 redshift bin, our results are summarised as follows:
-
ALMA stacks result in upper limits for galaxies with MUV> -19 and logM⋆ < 9, and tentative detections at brighter UV magnitudes and higher stellar masses at 6 < z < 7.
-
Upper limits for UV-faint galaxies are in agreement with predicted ALMA fluxes from UV-to-NIR SED fitting, while ALMA fluxes are lower than predicted for UV-bright MUV < −20 galaxies. For galaxies binned with stellar mass, the predicted fluxes without ALMA constraints and the ALMA fluxes are in agreement. However, for galaxies with logM⋆ < 9, there is a tension between the ALMA-derived upper limit (3σ) and the flux expected from scaling down the ALMA flux of the upper stellar mass bin. This is a hint at a possible lower dust-to-stellar-mass ratio at these low stellar masses.
-
The addition of the ALMA constraints for the SED modelling results in a lower SFR (0.4 dex), lower AFUV (0.5 dex) for galaxies with logM⋆ > 8, as well as slightly higher stellar masses and lower β for the same sources, implying an older stellar population (25% older on average).
-
Using infrared constraints for the SED modelling, our β versus MUV is consistent with measurements from the literature, and in perfect agreement with the relation from Topping et al. (2024).
-
Our measurements extend the LIR − MUV relation down to MUV ∼ −19 and hint at a possible breakdown of the relation at fainter UV magnitudes.
-
When the ALMA constraints are used in the fitting, galaxies are consistent with the literature (REBELS and ALPINE) when placed on the IRX against β, indicating a similar dust composition and content as in these UV-selected samples. Our stack measurements computed in bins of stellar masses do not provide strong constraints on the IRX-M⋆ relation. However, the position of our UV-bright bin (MUV < −20) is in good agreement with the relation from Bowler et al. (2024). Nevertheless, we find that a given stellar mass, the IRX decreases with increasing redshift.
We tested the impact of dust temperature assumption on our results and found that temperature assumptions between 36 K and 47 K yield similar LIR. However, pushing to a higher dust temperature (60 K) results in a higher LIR, as was expected. The conclusions obtained with a dust temperature of 47 K are still valid when the assumed dust temperature is lower. In the IRX-β diagram, our points are compatible with a Calzetti et al. (2000) relation using β0 = −2.3 or the Reddy et al. (2018) relation for starburst and SMC (β0 = −2.6). However, a high dust temperature (60 K) would bring our observations closer to the Reddy et al. (2018) relation for starbursts.
Combining the whole sample (6 < z < 12), we obtain the following results:
-
We did not find a clear evolution of β with redshift for the galaxies in our sample and showed that this absence of variation is not due to the lower limit in β0 imposed by our SED modelling procedure as only 5% of galaxies at z > 9 have the lowest value, and 15% of the whole sample at z > 6. Considering that the median MUV of our sample is –17.24
 , this non-evolution is consistent with the results of Topping et al. (2024) at a similar UV magnitude range.
 -
We provide upper limits on the IR luminosity of NIRCam-selected galaxies at z > 7, and show that the detected samples from the literature (REBELS, SERENADE, and individual detections) are not representative of the bulk of galaxies at these redshifts.
-
We confirm a linear relation between the V-band attenuation and the inverse sSFR, showing a non-negligible attenuation at sSFR−1 > 30 Myr and a flatter slope than the one obtained from Langeroodi et al. (2024) from a spectroscopic sample, due to the use of ALMA constraints in our physical property measurements.
Our results focused on 6 < z < 7 galaxies indicate that the dust properties at the Epoch of Reionisation are mostly similar to the ones in lower-redshift galaxies, implying that significant dust production must have already happened by z ∼ 6.5. However, the breakdown observed in the LIR versus MUV relation at MUV≥-19 is a possible hint of a different regime in the UV-faint galaxies. These galaxies have, on average, low masses (logM⋆ ∼ 8), resulting in shallower gravitational potential, allowing metals to escape, and resulting in less dust. Or the breakdown could be also be due to the lower SFR measured in this sources (∼0.5–2 M⊙ yr−1) resulting in a lower dust production. Nevertheless, the rapid build-up concluded from the 6 < z < 7 galaxies is also confirmed by the non-negligible amount of attenuation observed at sSFR−1 > 30 Myr for galaxies with 6 < z < 12.
Acknowledgments
LC warmly thanks A. Ferrara, J. Lewis, M. Trebitsch, and D. Elbaz for insightful discussions that improved greatly this work. The authors thank the JADES team for the huge work and effort put in the preparation, observation, and production of the data used in this work. This work received support from the French government under the France 2030 investment plan, as part of the Initiative d’Excellence d’Aix-Marseille Université – A*MIDEX AMX-22-RE-AB-101. This project has received financial support from CNRS and CNES through the MITI interdisciplinary programmes. SA gratefully acknowledges the Collaborative Research Center 1601 (SFB 1601 sub-project C2) funded by the Deutsche Forschungsgemeinschaft (DFG, German Research Foundation) – 500700252. LC and MB acknowledges the funding of the French Agence Nationale de la Recherche for the project iMAGE (grant ANR-22-CE31-0007). NIRCam was built by a team at the University of Arizona (UofA) and Lockheed Martin’s Advanced Technology Center, led by Prof. Marcia Rieke at UoA. ES acknowledges funding from the European Research Council (ERC) under the European Union’s Horizon 2020 research and innovation programme (grant agreement No. 694343). This work is based on observations made with the NASA/ESA/CSA James Webb Space Telescope. The data were obtained from the Mikulski Archive for Space Telescopes at the Space Telescope Science Institute, which is operated by the Association of Universities for Research in Astronomy, Inc., under NASA contract NAS 5-03127 for JWST. MB gratefully acknowledges support from the ANID BASAL project FB210003 and from the FONDECYT regular grant 1211000. This work was supported by the French government through the France 2030 investment plan managed by the National Research Agency (ANR), as part of the Initiative of Excellence of Université Côte d’Azur under reference number ANR-15-IDEX-01.
References
- Adscheid, S., Magnelli, B., Liu, D., et al. 2024, A&A, 685, A1 [NASA ADS] [CrossRef] [EDP Sciences] [Google Scholar]
- Algera, H. S. B., Inami, H., Oesch, P. A., et al. 2023, MNRAS, 518, 6142 [Google Scholar]
- Algera, H. S. B., Inami, H., De Looze, I., et al. 2024, MNRAS, 533, 3098 [NASA ADS] [CrossRef] [Google Scholar]
- Álvarez-Márquez, J., Colina, L., Marques-Chaves, R., et al. 2019, A&A, 629, A9 [NASA ADS] [CrossRef] [EDP Sciences] [Google Scholar]
- Arrabal Haro, P., Dickinson, M., Finkelstein, S. L., et al. 2023, ApJ, 951, L22 [NASA ADS] [CrossRef] [Google Scholar]
- Austin, D., Adams, N., Conselice, C. J., et al. 2023, ApJ, 952, L7 [NASA ADS] [CrossRef] [Google Scholar]
- Austin, D., Conselice, C. J., Adams, N. J., et al. 2024, arXiv e-prints [arXiv:2404.10751] [Google Scholar]
- Bakx, T. J. L. C., Tamura, Y., Hashimoto, T., et al. 2020, MNRAS, 493, 4294 [NASA ADS] [CrossRef] [Google Scholar]
- Barisic, I., Faisst, A. L., Capak, P. L., et al. 2017, ApJ, 845, 41 [Google Scholar]
- Bernhard, E., Béthermin, M., Sargent, M., et al. 2014, MNRAS, 442, 509 [NASA ADS] [CrossRef] [Google Scholar]
- Béthermin, M., Daddi, E., Magdis, G., et al. 2012, ApJ, 757, L23 [Google Scholar]
- Béthermin, M., Fudamoto, Y., Ginolfi, M., et al. 2020, A&A, 643, A2 [Google Scholar]
- Bhatawdekar, R., & Conselice, C. J. 2021, ApJ, 909, 144 [NASA ADS] [CrossRef] [Google Scholar]
- Boquien, M., Buat, V., Boselli, A., et al. 2012, A&A, 539, A145 [NASA ADS] [CrossRef] [EDP Sciences] [Google Scholar]
- Boquien, M., Burgarella, D., Roehlly, Y., et al. 2019, A&A, 622, A103 [NASA ADS] [CrossRef] [EDP Sciences] [Google Scholar]
- Boquien, M., Buat, V., Burgarella, D., et al. 2022, A&A, 663, A50 [NASA ADS] [CrossRef] [EDP Sciences] [Google Scholar]
- Bouwens, R. J., Illingworth, G. D., Oesch, P. A., et al. 2014, ApJ, 793, 115 [Google Scholar]
- Bouwens, R. J., Aravena, M., Decarli, R., et al. 2016, ApJ, 833, 72 [NASA ADS] [CrossRef] [Google Scholar]
- Bouwens, R. J., Smit, R., Schouws, S., et al. 2022, ApJ, 931, 160 [NASA ADS] [CrossRef] [Google Scholar]
- Bowler, R. A. A., Bourne, N., Dunlop, J. S., McLure, R. J., & McLeod, D. J. 2018, MNRAS, 481, 1631 [Google Scholar]
- Bowler, R. A. A., Cullen, F., McLure, R. J., Dunlop, J. S., & Avison, A. 2022, MNRAS, 510, 5088 [NASA ADS] [CrossRef] [Google Scholar]
- Bowler, R. A. A., Inami, H., Sommovigo, L., et al. 2024, MNRAS, 527, 5808 [Google Scholar]
- Brammer, G. B., van Dokkum, P. G., & Coppi, P. 2008, ApJ, 686, 1503 [Google Scholar]
- Bruzual, G., & Charlot, S. 2003, MNRAS, 344, 1000 [NASA ADS] [CrossRef] [Google Scholar]
- Buat, V., Oi, N., Heinis, S., et al. 2015, A&A, 577, A141 [NASA ADS] [CrossRef] [EDP Sciences] [Google Scholar]
- Bunker, A. J., Cameron, A. J., Curtis-Lake, E., et al. 2024, A&A, 690, A288 [NASA ADS] [CrossRef] [EDP Sciences] [Google Scholar]
- Calzetti, D., Kinney, A. L., & Storchi-Bergmann, T. 1994, ApJ, 429, 582 [Google Scholar]
- Calzetti, D., Armus, L., Bohlin, R. C., et al. 2000, ApJ, 533, 682 [NASA ADS] [CrossRef] [Google Scholar]
- Capak, P. L., Carilli, C., Jones, G., et al. 2015, Nature, 522, 455 [NASA ADS] [CrossRef] [Google Scholar]
- Castellano, M., Fontana, A., Treu, T., et al. 2022, ApJ, 938, L15 [NASA ADS] [CrossRef] [Google Scholar]
- Ciesla, L., Elbaz, D., & Fensch, J. 2017, A&A, 608, A41 [NASA ADS] [CrossRef] [EDP Sciences] [Google Scholar]
- Ciesla, L., Elbaz, D., Ilbert, O., et al. 2024, A&A, 686, A128 [NASA ADS] [CrossRef] [EDP Sciences] [Google Scholar]
- Cole, J. W., Papovich, C., Finkelstein, S. L., et al. 2025, ApJ, 979, 193 [Google Scholar]
- Cullen, F., McLure, R. J., McLeod, D. J., et al. 2023, MNRAS, 520, 14 [NASA ADS] [CrossRef] [Google Scholar]
- Curtis-Lake, E., Carniani, S., Cameron, A., et al. 2023, Nature Astronomy, 7, 622 [NASA ADS] [CrossRef] [Google Scholar]
- da Cunha, E., Groves, B., Walter, F., et al. 2013, ApJ, 766, 13 [Google Scholar]
- Donnan, C. T., McLeod, D. J., Dunlop, J. S., et al. 2023, MNRAS, 518, 6011 [Google Scholar]
- Draine, B. T. 1978, ApJS, 36, 595 [Google Scholar]
- Dwek, E. 1986, ApJ, 302, 363 [Google Scholar]
- Eisenstein, D. J., Willott, C., Alberts, S., et al. 2023a, arXiv e-prints [arXiv:2306.02465] [Google Scholar]
- Eisenstein, D. J., Johnson, B. D., Robertson, B., et al. 2023b, arXiv e-prints [arXiv:2310.12340] [Google Scholar]
- Elbaz, D., Leiton, R., Nagar, N., et al. 2018, A&A, 616, A110 [NASA ADS] [CrossRef] [EDP Sciences] [Google Scholar]
- Endsley, R., Stark, D. P., Fan, X., et al. 2022, MNRAS, 512, 4248 [CrossRef] [Google Scholar]
- Faisst, A. L., Schaerer, D., Lemaux, B. C., et al. 2020, ApJS, 247, 61 [NASA ADS] [CrossRef] [Google Scholar]
- Ferrara, A., Sommovigo, L., Dayal, P., et al. 2022, MNRAS, 512, 58 [NASA ADS] [CrossRef] [Google Scholar]
- Ferrara, A., Pallottini, A., & Dayal, P. 2023, MNRAS, 522, 3986 [NASA ADS] [CrossRef] [Google Scholar]
- Finkelstein, S. L., Papovich, C., Salmon, B., et al. 2012, ApJ, 756, 164 [NASA ADS] [CrossRef] [Google Scholar]
- Finkelstein, S. L., Bagley, M. B., Ferguson, H. C., et al. 2023, ApJ, 946, L13 [NASA ADS] [CrossRef] [Google Scholar]
- Franco, M., Elbaz, D., Béthermin, M., et al. 2018, A&A, 620, A152 [NASA ADS] [CrossRef] [EDP Sciences] [Google Scholar]
- Franco, M., Akins, H. B., Casey, C. M., et al. 2024, ApJ, 973, 23 [NASA ADS] [CrossRef] [Google Scholar]
- Fudamoto, Y., Oesch, P. A., Faisst, A., et al. 2020, A&A, 643, A4 [NASA ADS] [CrossRef] [EDP Sciences] [Google Scholar]
- Gómez-Guijarro, C., Elbaz, D., Xiao, M., et al. 2022, A&A, 658, A43 [NASA ADS] [CrossRef] [EDP Sciences] [Google Scholar]
- Hainline, K. N., Johnson, B. D., Robertson, B., et al. 2024, ApJ, 964, 71 [CrossRef] [Google Scholar]
- Harikane, Y., Nakajima, K., Ouchi, M., et al. 2024, ApJ, 960, 56 [NASA ADS] [CrossRef] [Google Scholar]
- Hashimoto, T., Inoue, A. K., Mawatari, K., et al. 2019, PASJ, 71, 71 [Google Scholar]
- Haskell, P., Smith, D. J. B., Cochrane, R. K., Hayward, C. C., & Anglés-Alcázar, D. 2023, MNRAS, 525, 1535 [NASA ADS] [CrossRef] [Google Scholar]
- Heinis, S., Buat, V., Béthermin, M., et al. 2014, MNRAS, 437, 1268 [Google Scholar]
- Heintz, K. E., Brammer, G. B., Watson, D., et al. 2025, A&A, 693, A60 [Google Scholar]
- Hodge, J. A., Swinbank, A. M., Simpson, J. M., et al. 2016, ApJ, 833, 103 [Google Scholar]
- Hollenbach, D. J., & Tielens, A. G. G. M. 1997, ARA&A, 35, 179 [NASA ADS] [CrossRef] [Google Scholar]
- Inami, H., Algera, H. S. B., Schouws, S., et al. 2022, MNRAS, 515, 3126 [NASA ADS] [CrossRef] [Google Scholar]
- Khusanova, Y., Bethermin, M., Le Fèvre, O., et al. 2021, A&A, 649, A152 [NASA ADS] [CrossRef] [EDP Sciences] [Google Scholar]
- Komatsu, E., Smith, K. M., Dunkley, J., et al. 2011, ApJS, 192, 18 [Google Scholar]
- Koprowski, M. P., Coppin, K. E. K., Geach, J. E., et al. 2018, MNRAS, 479, 4355 [NASA ADS] [CrossRef] [Google Scholar]
- Langeroodi, D., Hjorth, J., Ferrara, A., & Gall, C. 2024, arXiv e-prints [arXiv:2410.14671] [Google Scholar]
- Laporte, N., Ellis, R. S., Boone, F., et al. 2017, ApJ, 837, L21 [CrossRef] [Google Scholar]
- Laporte, N., Katz, H., Ellis, R. S., et al. 2019, MNRAS, 487, L81 [Google Scholar]
- Le Fèvre, O., Béthermin, M., Faisst, A., et al. 2020, A&A, 643, A1 [Google Scholar]
- Li, J., Da Cunha, E., González-López, J., et al. 2024, ApJ, 976, 70 [NASA ADS] [CrossRef] [Google Scholar]
- Liu, D., Lang, P., Magnelli, B., et al. 2019, ApJS, 244, 40 [Google Scholar]
- Magnelli, B., Adscheid, S., Wang, T.-M., et al. 2024, A&A, 688, A55 [NASA ADS] [CrossRef] [EDP Sciences] [Google Scholar]
- Markov, V., Gallerani, S., Ferrara, A., et al. 2025, Nat. Astron., 9, 458 [Google Scholar]
- Meurer, G. R., Heckman, T. M., & Calzetti, D. 1999, ApJ, 521, 64 [Google Scholar]
- Mitsuhashi, I., Harikane, Y., Bauer, F. E., et al. 2024, ApJ, 971, 161 [NASA ADS] [CrossRef] [Google Scholar]
- Naidu, R. P., Oesch, P. A., van Dokkum, P., et al. 2022, ApJ, 940, L14 [NASA ADS] [CrossRef] [Google Scholar]
- Narayanan, D., Conroy, C., Davé, R., Johnson, B. D., & Popping, G. 2018, ApJ, 869, 70 [Google Scholar]
- Pallottini, A., Ferrara, A., Gallerani, S., et al. 2022, MNRAS, 513, 5621 [NASA ADS] [Google Scholar]
- Pannella, M., Elbaz, D., Daddi, E., et al. 2015, ApJ, 807, 141 [Google Scholar]
- Popping, G., Somerville, R. S., & Galametz, M. 2017, MNRAS, 471, 3152 [NASA ADS] [CrossRef] [Google Scholar]
- Reddy, N. A., Shapley, A. E., Sanders, R. L., et al. 2018, ApJ, 869, 92 [NASA ADS] [CrossRef] [Google Scholar]
- Rieke, M. J., Robertson, B., Tacchella, S., et al. 2023, ApJS, 269, 16 [NASA ADS] [CrossRef] [Google Scholar]
- Roberts-Borsani, G., Treu, T., Shapley, A., et al. 2024, ApJ, 976, 193 [NASA ADS] [CrossRef] [Google Scholar]
- Robertson, B. E., Tacchella, S., Johnson, B. D., et al. 2023, Nat. Astron., 7, 611 [NASA ADS] [CrossRef] [Google Scholar]
- Robertson, B., Johnson, B. D., Tacchella, S., et al. 2024, ApJ, 970, 31 [NASA ADS] [CrossRef] [Google Scholar]
- Rogers, A. B., McLure, R. J., Dunlop, J. S., et al. 2014, MNRAS, 440, 3714 [Google Scholar]
- Rowland, L. E., Stefanon, M., Bouwens, R., et al. 2025, arXiv e-prints [arXiv:2501.10559] [Google Scholar]
- Salim, S., & Narayanan, D. 2020, ARA&A, 58, 529 [NASA ADS] [CrossRef] [Google Scholar]
- Salpeter, E. E. 1955, ApJ, 121, 161 [Google Scholar]
- Saxena, A., Cameron, A. J., Katz, H., et al. 2024, arXiv e-prints [arXiv:2411.14532] [Google Scholar]
- Schouws, S., Stefanon, M., Bouwens, R., et al. 2022, ApJ, 928, 31 [NASA ADS] [CrossRef] [Google Scholar]
- Schouws, S., Bouwens, R. J., Ormerod, K., et al. 2025, ApJ, 988, 19 [Google Scholar]
- Schreiber, C., Elbaz, D., Pannella, M., et al. 2018, A&A, 609, A30 [NASA ADS] [CrossRef] [EDP Sciences] [Google Scholar]
- Seillé, L. M., Buat, V., Haddad, W., et al. 2022, A&A, 665, A137 [NASA ADS] [CrossRef] [EDP Sciences] [Google Scholar]
- Shivaei, I., Alberts, S., Florian, M., et al. 2024, A&A, 690, A89 [NASA ADS] [CrossRef] [EDP Sciences] [Google Scholar]
- Sommovigo, L., Ferrara, A., Pallottini, A., et al. 2022, MNRAS, 513, 3122 [NASA ADS] [CrossRef] [Google Scholar]
- Sugahara, Y., Inoue, A. K., Hashimoto, T., et al. 2021, ApJ, 923, 5 [NASA ADS] [CrossRef] [Google Scholar]
- Tamura, Y., Mawatari, K., Hashimoto, T., et al. 2019, ApJ, 874, 27 [NASA ADS] [CrossRef] [Google Scholar]
- Topping, M. W., Stark, D. P., Endsley, R., et al. 2024, MNRAS, 529, 4087 [NASA ADS] [CrossRef] [Google Scholar]
- Vijayan, A. P., Wilkins, S. M., Lovell, C. C., et al. 2022, MNRAS, 511, 4999 [NASA ADS] [CrossRef] [Google Scholar]
- Wang, T.-M., Magnelli, B., Schinnerer, E., et al. 2022, A&A, 660, A142 [NASA ADS] [CrossRef] [EDP Sciences] [Google Scholar]
- Wang, T.-M., Magnelli, B., Schinnerer, E., et al. 2024, A&A, 681, A110 [NASA ADS] [CrossRef] [EDP Sciences] [Google Scholar]
- Watson, D., Christensen, L., Knudsen, K. K., et al. 2015, Nature, 519, 327 [Google Scholar]
- Williams, C. C., Tacchella, S., Maseda, M. V., et al. 2023, ApJS, 268, 64 [NASA ADS] [CrossRef] [Google Scholar]
- Witstok, J., Smit, R., Maiolino, R., et al. 2022, MNRAS, 515, 1751 [Google Scholar]
- Wolfire, M. G., Hollenbach, D., McKee, C. F., Tielens, A. G. G. M., & Bakes, E. L. O. 1995, ApJ, 443, 152 [Google Scholar]
All Tables
Stacked physical properties at 6 < z < 7 derived from the SED modelling using the ALMA constraint.
All Figures
|
Fig. 1. Normalised distributions of the physical properties of the 6 < z < 7 JADES selected sample obtained from UV-to-NIR rest-frame SED modelling (without IR). From left to right, and top to bottom: UV magnitude, stellar mass, SFR, and UV slope, β. |
| In the text | |
|
Fig. 2. Left panel: Flux densities obtained by stacking ALMA observations in four UV magnitude bins (black symbols). Circles with downward arrows are 3σ upper limits. The contours show the spread of predicted fluxes without the ALMA constraint. The grey circles with black borders are the median values of these predicted fluxes in each UV magnitude bin. The blue squares are the stack values of the REBELS sample (Bowler et al. 2024). Right panel: Same as left panel but using three stellar mass bins. The white circle is the expected flux density assuming a simple scaling to the stellar mass of the 9 < logM⋆ < 10 bin. |
| In the text | |
|
Fig. 3. Example of SED for a source at z = 6.78 in the 9 < log(M⋆no − IR/M⊙)< 10 stellar mass bin. The open black squares are the fluxes from HST and JWST and the blue line is the best fit model obtained fitting these data points. The filled black square indicates the ALMA measurement from stacks obtained in the same stellar mass bin, and the red line indicates the best fit model obtained when adding this IR constraint to the SED fitting. Parameters obtained from the two fits are indicated using the same colours. As an indication, the best SEDs obtained from the rest of the galaxies in the same stellar mass bin are shown in light grey. |
| In the text | |
|
Fig. 4. Comparison between the physical properties obtained when fitting the UV-to-NIR rest-frame observations only (HST+JWST) and the ones obtained when adding the ALMA constraints. The solid black line is the one-to-one relationship. Results for the stellar mass, SFR, FUV attenuation, and β are shown from left to right. The black circles with error bars indicate the median error in each panel. The inset panels show the same figure for the most massive (logM⋆no − IR/M⊙ > 8) sources in the sample. |
| In the text | |
|
Fig. 5. β as a function of UV magnitude. Big circles with black edges are weighted medians in four UV magnitude bins. Samples from the literature are indicated by symbols with different shades of blue (Bowler et al. 2024; Cullen et al. 2023; Austin et al. 2023; Roberts-Borsani et al. 2024; Mitsuhashi et al. 2024), white edges showing individual galaxies and black edges stacked or median values. The relation from Topping et al. (2024) is shown with the solid line. |
| In the text | |
|
Fig. 6. Infrared luminosity as a function of UV magnitude. The contours show the position of the whole sample with LIR obtained from the fit using the ALMA constraint. Big circles with black borders are the weighted median values in four UV magnitude bins. Stacked or median values for samples from the literature are shown in various shades of blue symbols (Bowler et al. 2024; Khusanova et al. 2021). |
| In the text | |
|
Fig. 7. IRX as a function of β. Coloured circles with black borders are weighted medians derived in four UV magnitude bins from our sample. The blue squares are the stacked values of Bowler et al. (2024) for the REBELS sample. The light blue downward triangles are the ALPINE z > 5 from Boquien et al. (2022), while the dark blue triangles are ALPINE stacks at z > 5 values from Fudamoto et al. (2020). The solid thick black line is the relation assuming a Calzetti et al. (2000) attenuation law, while the dotted line is the one assuming a SMC-like extinction curve. The thin black lines are the corresponding relations from Reddy et al. (2018). |
| In the text | |
|
Fig. 8. IRX as a function of stellar mass. Circles with black edges are weighted medians colour-coded according to the stellar mass bin used for stacking. The red star is the position of the −22 < MUV < −20 bin for direct comparison with the stacked values of Bowler et al. (2024) for the REBELS sample (blue squares). The light blue downward triangles are the ALPINE z > 5 stacks values from Boquien et al. (2022). The solid light purple line is the relation from Magnelli et al. (2024), the dashed line is from Fudamoto et al. (2020), the dash-dotted line is the relation from Bowler et al. (2024), and the dotted light purple line the relation from Pannella et al. (2015) at lower redshifts. The darker the color of these relations, the higher the redshifts of the galaxies used to derive them. |
| In the text | |
|
Fig. 9. LIR distributions of galaxies in the four UV magnitude bins considered in this work, assuming different dust temperatures. |
| In the text | |
|
Fig. 10. LIR distributions of galaxies in the three stellar mass bins considered in this work, assuming different dust temperatures. |
| In the text | |
|
Fig. 11. Left panel: IRX as a function of stellar mass (symbols and lines following Fig. 8, except the upper limits that are shown here with coloured downward triangles). Filled coloured circles are the stacked measurements obtained for each temperature assumption. Right panel: IRX-β diagram (symbols and lines following Fig. 7). Galaxies are colour-coded as in the left panel. |
| In the text | |
|
Fig. 12. β as a function of redshift. Grey contours show the full JADES/A3COSMOS sample, while purple circles show the median position in several redshift bins. Different samples from the literature are shown in shades of blue (Laporte et al. 2017, 2019; Tamura et al. 2019; Inami et al. 2022; Mitsuhashi et al. 2024; Schouws et al. 2025; Topping et al. 2024). The inset panel shows the distribution of the intrinsic UV slope, β0, allowed by the models (dark blue), as well as β0 and β obtained from the SED fitting. |
| In the text | |
|
Fig. 13. IR luminosity as a function of redshift for our sample (black contours, downward arrows indicate upper limits) and different samples from the literature (shades of blue, Laporte et al. 2017, 2019; Tamura et al. 2019; Inami et al. 2022; Mitsuhashi et al. 2024; Schouws et al. 2025). Symbols with downward arrows are upper limits. Circles with black borders are our fiducial UV magnitude bins. |
| In the text | |
|
Fig. 14. Left: AV attenuation as a function of sSFR−1. Galaxies with 6 < z < 12 are binned with the UV β slope (circles). The solid black line is the linear fit of these binned points. Predictions of the linear AV-sSFR−1 relation at a fixed SFR surface density from Langeroodi et al. (2024) are indicated with dashed coloured lines. The stacked points obtained by Langeroodi et al. (2024) are shown as cyan hexagons. Right: Same as in the left panel but using the AV and sSFR−1 obtained with the UV-NIR SED fit; that is, without ALMA constraints. |
| In the text | |
Current usage metrics show cumulative count of Article Views (full-text article views including HTML views, PDF and ePub downloads, according to the available data) and Abstracts Views on Vision4Press platform.
Data correspond to usage on the plateform after 2015. The current usage metrics is available 48-96 hours after online publication and is updated daily on week days.
Initial download of the metrics may take a while.