Fig. 13.
Download original image
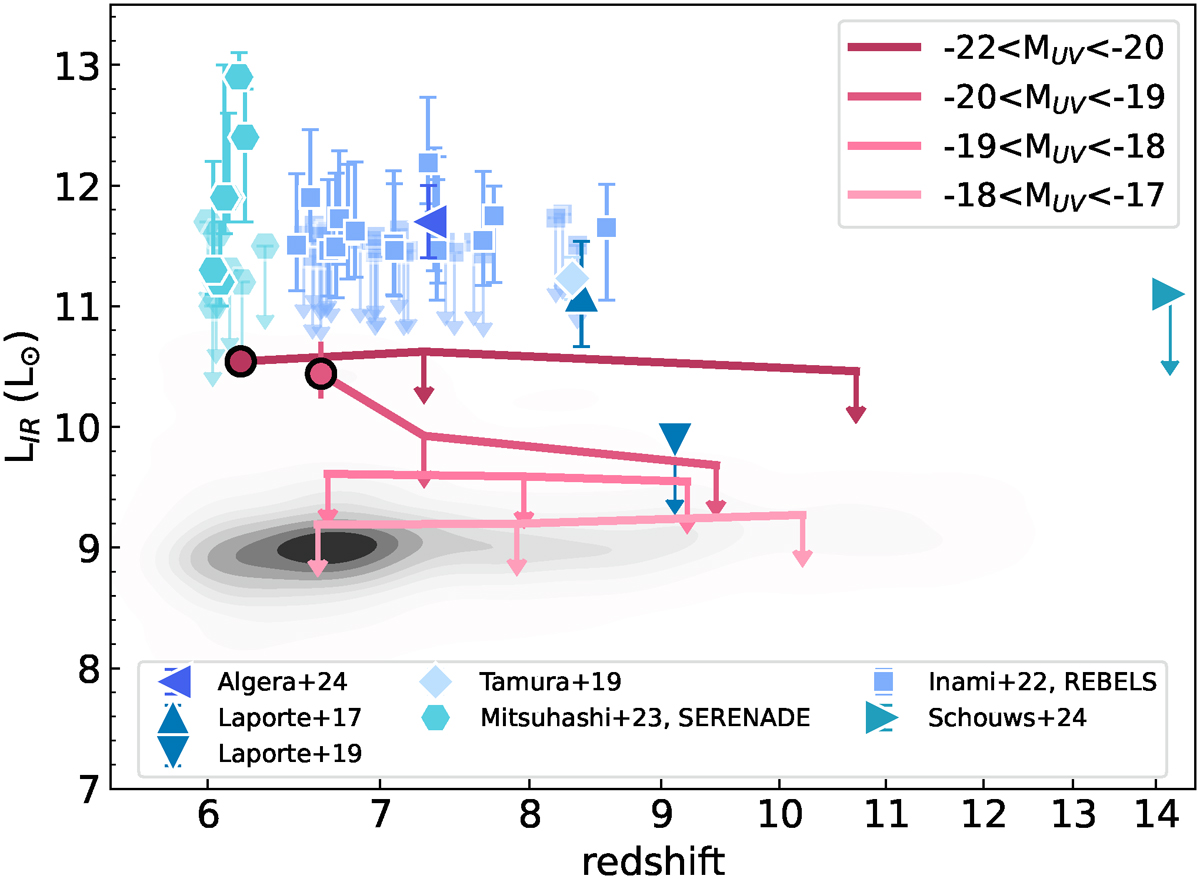
IR luminosity as a function of redshift for our sample (black contours, downward arrows indicate upper limits) and different samples from the literature (shades of blue, Laporte et al. 2017, 2019; Tamura et al. 2019; Inami et al. 2022; Mitsuhashi et al. 2024; Schouws et al. 2025). Symbols with downward arrows are upper limits. Circles with black borders are our fiducial UV magnitude bins.
Current usage metrics show cumulative count of Article Views (full-text article views including HTML views, PDF and ePub downloads, according to the available data) and Abstracts Views on Vision4Press platform.
Data correspond to usage on the plateform after 2015. The current usage metrics is available 48-96 hours after online publication and is updated daily on week days.
Initial download of the metrics may take a while.