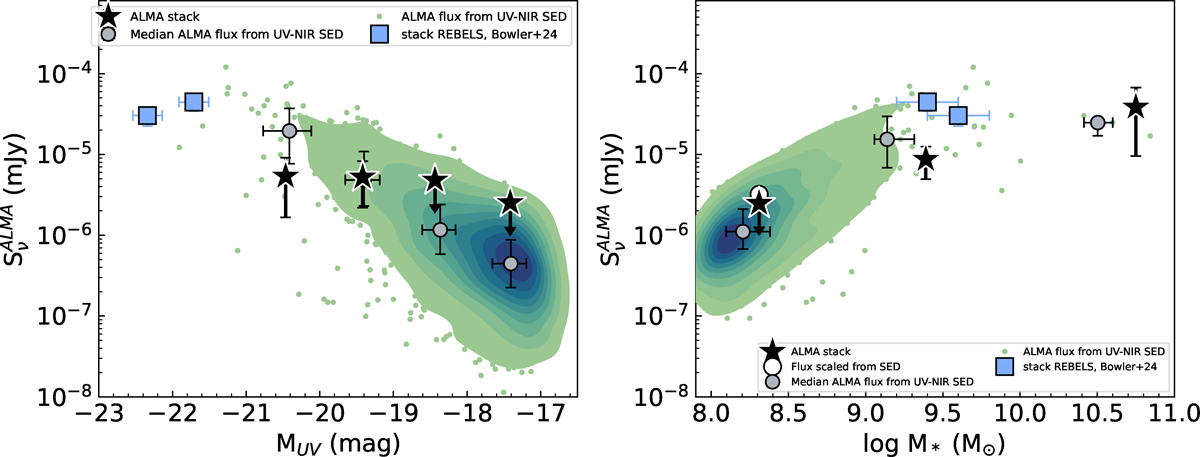
Fig. 2.
Download original image
Left panel: Flux densities obtained by stacking ALMA observations in four UV magnitude bins (black symbols). Circles with downward arrows are 3σ upper limits. The contours show the spread of predicted fluxes without the ALMA constraint. The grey circles with black borders are the median values of these predicted fluxes in each UV magnitude bin. The blue squares are the stack values of the REBELS sample (Bowler et al. 2024). Right panel: Same as left panel but using three stellar mass bins. The white circle is the expected flux density assuming a simple scaling to the stellar mass of the 9 < logM⋆ < 10 bin.
Current usage metrics show cumulative count of Article Views (full-text article views including HTML views, PDF and ePub downloads, according to the available data) and Abstracts Views on Vision4Press platform.
Data correspond to usage on the plateform after 2015. The current usage metrics is available 48-96 hours after online publication and is updated daily on week days.
Initial download of the metrics may take a while.