Fig. 4.
Download original image
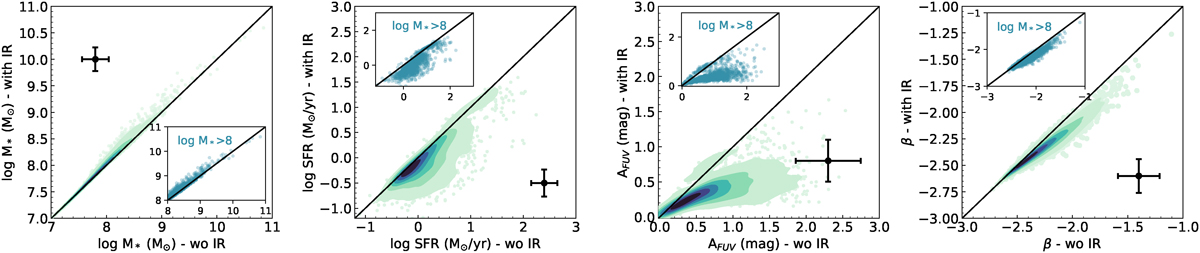
Comparison between the physical properties obtained when fitting the UV-to-NIR rest-frame observations only (HST+JWST) and the ones obtained when adding the ALMA constraints. The solid black line is the one-to-one relationship. Results for the stellar mass, SFR, FUV attenuation, and β are shown from left to right. The black circles with error bars indicate the median error in each panel. The inset panels show the same figure for the most massive (logM⋆no − IR/M⊙ > 8) sources in the sample.
Current usage metrics show cumulative count of Article Views (full-text article views including HTML views, PDF and ePub downloads, according to the available data) and Abstracts Views on Vision4Press platform.
Data correspond to usage on the plateform after 2015. The current usage metrics is available 48-96 hours after online publication and is updated daily on week days.
Initial download of the metrics may take a while.